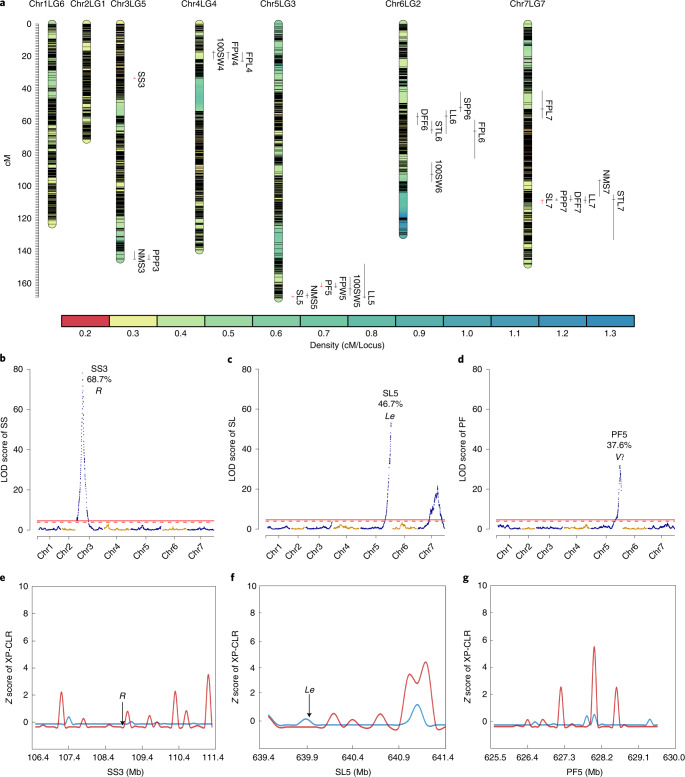
Fig. 5. Results of QTL analysis for 12 agronomic traits in pea as well as candidate gene and selective signals in three QTLs associated with three Mendel’s traits.
a , 25 QTLs were identified to be associated with 12 agronomic traits, and red bars indicate four QTLs in related to the three Mendel’s traits of seed shape (SS), stem length (SL) and pod form (PF). b–d, distribution of LOD score, PVE and candidate genes in SS3 (b), SL5 (c) and PF5 (d), with the red solid and broken lines representing thresholds of 0.01 and 0.05, respectively. e–g, Candidate selective signals in SS3 (e), SL5 (f) and PF5 (g) based on results of XP-CLR analysis between species within Pisum, with the red line representing P. fulvum versus P. sativum with α0.05 = 2.18 and the blue line representing P. fulvum versus P. abyssinicum with α0.05 = 0.39.

