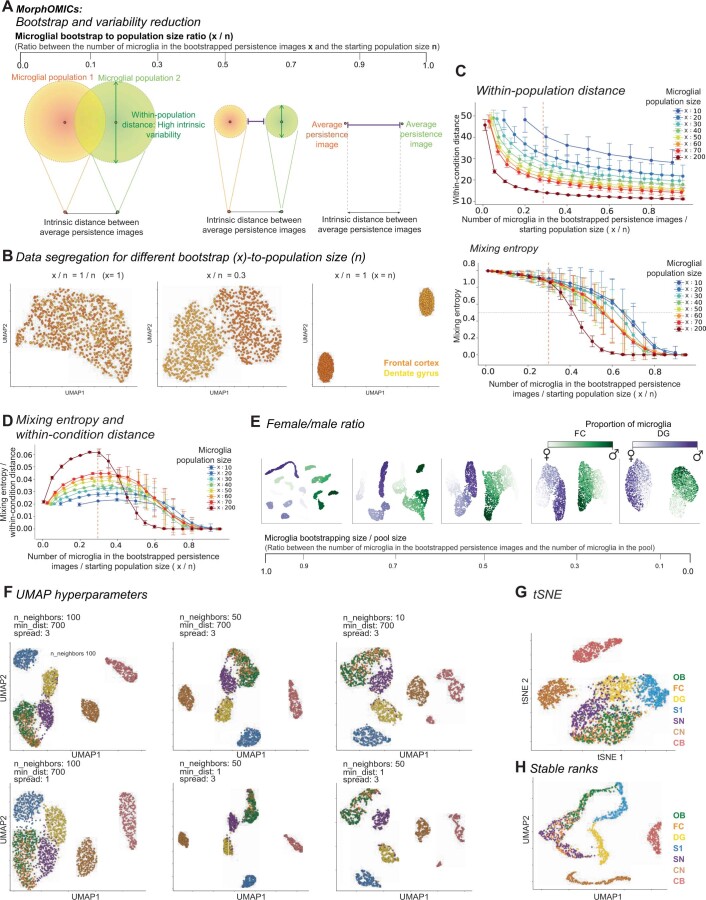
Extended Data Fig. 2. Details about the MorphOMICs paradigm.
a: Schematic of the bootstrapping effects on the distance between tree structures from the same population (within-population distance, green arrows) and two distinct populations (distance between average persistence images, purple lines). Increase of bootstrap-to-population size ratio (x/n) reduces within-population distance and increases distance between average persistence images. b: UMAP plots of MorphOMICs-analyzed microglia for frontal cortex (orange) and dentate gyrus (yellow) for different bootstrap-to-population size ratios. Left: x = 1, allows no segregation. Middle: x/n = 0.3. Right: x/n = 1 causes accentuation. c, d: Line plot ± SD displays how within-population distance (c, top) and mixing entropy (c, bottom), and the ratio between mixing entropy and within-condition distance (d) varies by enhancing bootstrap-to-population size ratio (x/n). An empirical threshold of 0.3 was selected (red dashed line). Data are presented as mean values ± SD. e: UMAP plots of MorphOMICs-analyzed microglia for frontal cortex (green) and dentate gyrus (purple) for different bootstrap-to-population size ratios and varying male-to-female ratios within the population size. f: UMAP plots of MorphOMICs-analyzed microglial morphology across seven brain regions as shown for Fig. 1f with examples of tested hyperparameters for number of neighbors (n_neighbors), minimum distance (min_dist), and spread. Olfactory bulb (OB), frontal cortex (FC), dentate gyrus (DG), somatosensory cortex (S1), substantia nigra (SN), cochlear nucleus (CN), and cerebellum (CB). g: tSNE plot of MorphOMICs-analyzed microglia across seven brain regions as shown in Fig. 1f. h: UMAP plots of stable ranks representation of microglial morphology (see Methods: Stable Ranks) across seven brain regions. nsamples = 500 per condition (see also Methods: Average and bootstrapped persistence images). SD: standard deviation.

