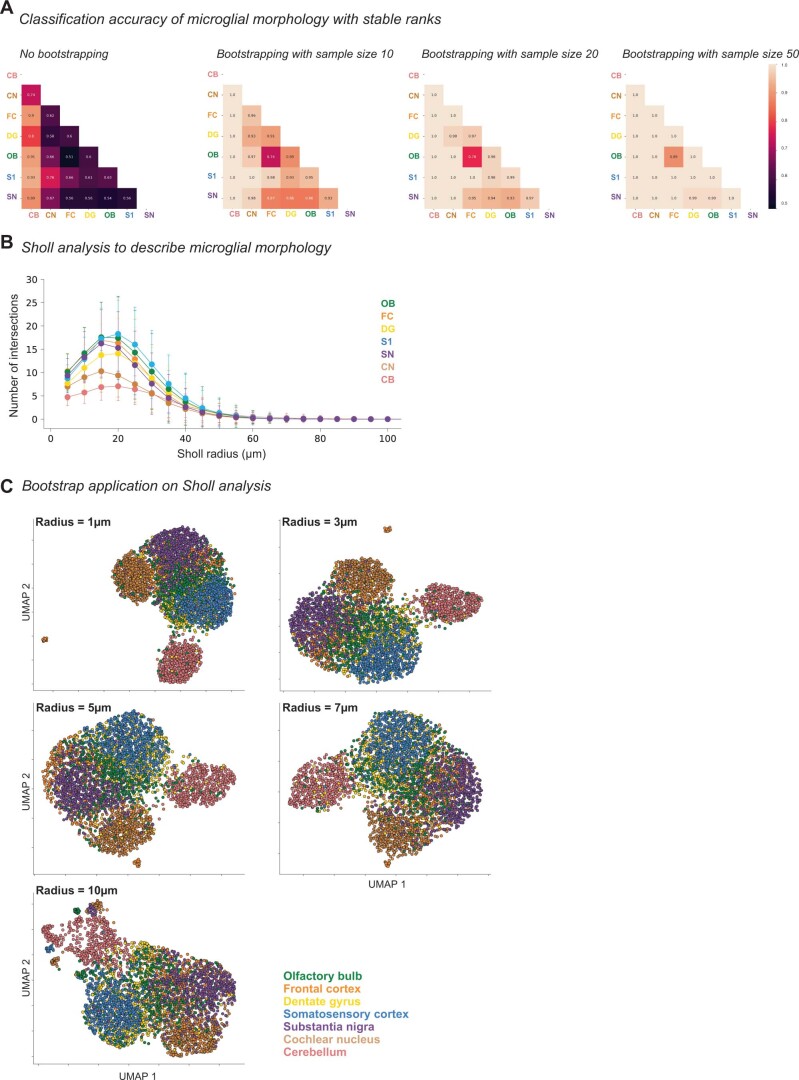
Extended Data Fig. 3. Classification accuracy of microglial morphology and bootstrap application on Sholl analysis.
a: Heat-map of classification accuracy between pairs of brain regions using stable ranks for different bootstrap sizes. Numbers indicates the percentage of microglia correctly assigned in the classification task, averaged over 10 repeated cross-validations. 1, perfect assignment; 0.5 random assignment. b: Sholl curves for each brain region. Data are presented as mean number of processes (points) ± SD that intersect with a series of concentric Sholl spheres centered on the soma and spaced at 5 µm. For number of animals per condition and region see Supplementary Table 4, 5. c: Bootstrapped and UMAP visualized Sholl-analyzed microglia, color-coded for each brain region. Each dot represents a bootstrapped Sholl analysis. Each plot has a set radius step size (1, 3, 5, 7, 10 µm). Olfactory bulb (OB), frontal cortex (FC), dentate gyrus (DG), somatosensory cortex (S1), substantia nigra (SN), cochlear nucleus (CN), and cerebellum (CB). nsamples = 300 per condition (see also Methods: Average and bootstrapped persistence images). SD: standard deviation.

