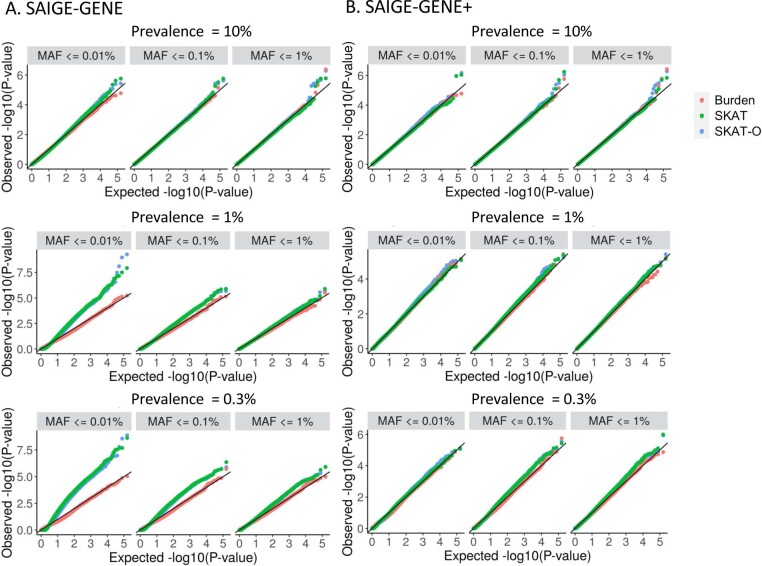
Extended Data Fig. 4. Quantile-quantile plots for Burden, SKAT, and SKAT-O tests P values for simulated phenotypes with prevalence 10%, 1%, and 0.3% based on the UKBB WES data under the null hypothesis.
a, Using SAIGE-GENE. b, Using SAIGE-GENE+, which collapses ultra-rare variants with MAC ≤ 10 prior to the gene-based association tests. The tests were performed for 18,372 genes with missense and loss-of-function variants with three different maximum MAF cutoffs (1%, 0.1%, and 0.01%). Tests conducted in the analysis were two-sided.

