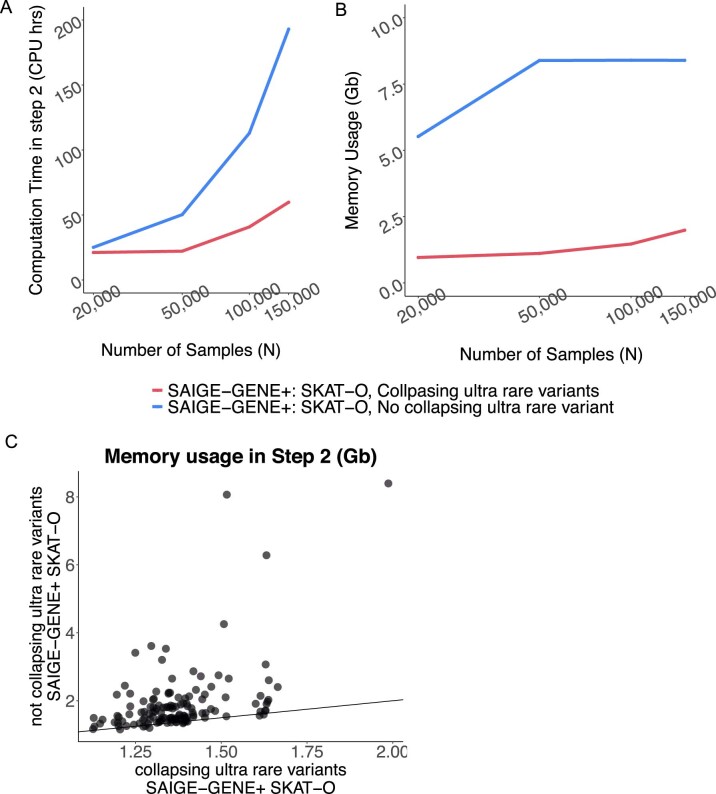
Extended Data Fig. 7. Computational cost of Step 2 in SAIGE-GENE+ with and without collapsing ultra-rare variants by sample sizes for gene-based tests for 18,372 genes with three maximum MAF cutoffs (1%, 0.1%, and 0.01%) and three variant annotations (LoF only, LoF + missense, and LoF + missense + synonymous).
In total, around 165,348 tests were run for each data set. Benchmarking was performed on randomly sub-sampled UK Biobank WES data with White British participants for glaucoma (1,741 cases and 162,408 controls). The reported run times and memory are medians of five runs with samples randomly selected from the full sample set using different sampling seeds. a, Plots of the time usage as a function of sample size (N). b, Plots of the maximum memory usage (for genes containing most variants) as a function of sample size (N). The x-axis is plotted on the log2 scale. c, Scatter plots of the memory usage when N = 150,000 simulated with a random seed. We split the 165,348 tests into 133 chunks, each with ~150 genes. For each gene, nine SKAT-O tests were conducted corresponding to three different MAF cutoffs and functional annotations followed by combining the P values using the Cauchy combination or minimum P-value approach. Tests conducted in the analysis were two-sided. Each dot in the plot is the maximum memory usage of a chunk among five runs with different random seeds.

