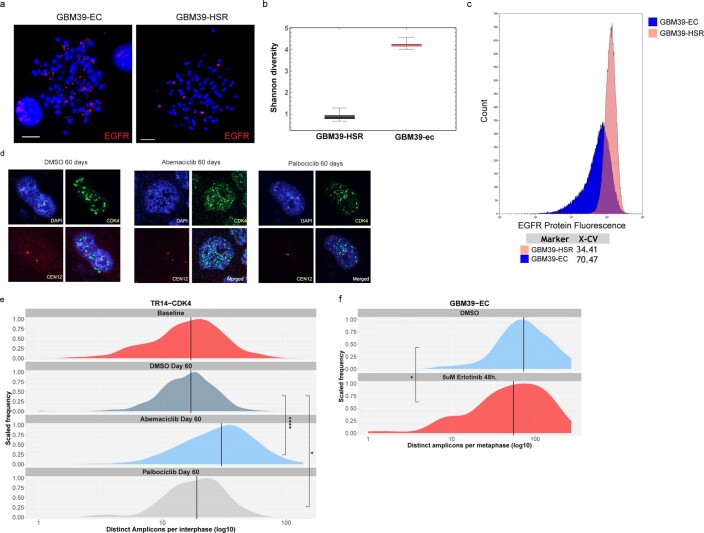
Extended Data Fig. 7. ecDNA dynamically responds to therapeutics.
a, Representative images of metaphase spread FISH from isogenic GBM39 cell line. b, Stochastic simulations of Shannon diversity under either either random ecDNA inheritance (GBM39-EC) or canonical chromosomal inheritance (GBM39-HSR). 100 stochastic simulations were run for each condition. Boxplots are shown with line at median and box ranging from 25th to 75th percentile, whiskers extendting to most extreme value. c, Flow cytometry analysis of EGFR protein expression in isogenic GBM39-EC and GBM39-HSR cell lines shows pattern of heterogeneity similar to that seen in copy number. X-CV quantifies the % coefficient of variation for the two samples. We used FSC-A/SSC-A to locate the major cell population, and FSC-H/FSC-W to gate the single cells. We used a negative control sample (secondary only) to adjust the voltage for the Alexa-Fluor488 channel. d, Representative images of TR14 cells treated with Abemaciclib or Palbociclib for 60 days. CDK4 FISH signal shown in green, CEN12 control FISH probe shown in red. e, Quantification of experiment described in d shows significant shift in CDK4 ecDNA copy number distribution under both drug conditions. f, Quantification of EGFR ecDNA in GBM39-EC cells after short-term treatment with erlotinib shows rapid change in ecDNA copy number distribution. Lines indicate medians. P values calculated using Mann-Whitney tests. * p ≤ 0.05; **** p ≤ 0.0001. Scale bars 10 µm.

