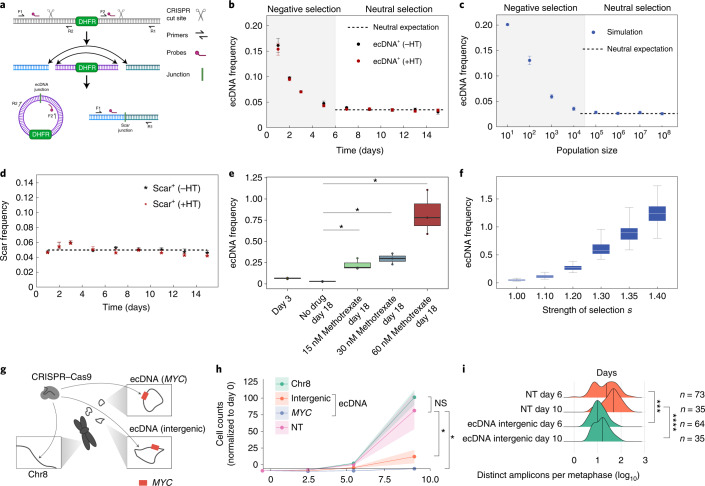
Fig. 3. Strong selection for ecDNA in cancer.
a, Schematic depicting the CRISPR-C strategy used to generate a single ecDNA in HAP1 cells containing the DHFR gene. DHFR ecDNA and the chromosomal scar are detected by ddPCR across the new junction sites. b, Tracking mean ecDNA copy number in HAP1 cells by ddPCR after day 0 induction of ecDNA by CRISPR-C. Neutral selection for DHFR ecDNA observed by similarity between hypoxanthine and thymidine omission or inclusion. c, Simulation of mean ecDNA number mimicking the experimental conditions in b. Negative selection s = 0.5, neutral selection s = 1. d, Mean frequency of the chromosomal scar determined by ddPCR across the scar junction. e, Mean ecDNA copy number after ecDNA induction on day 0 ± methotrexate treatment begun on day 4. b–e, CRISPR-C data from 3 biological replicates; data are presented as mean ± s.e.m.; P values from two-sided t-tests. e,f, Box plots are shown with line at the median and box ranging from the 25th to the 75th percentile, with the whiskers extending to the most extreme value. f, Simulation of mean ecDNA copy number mimicking the experiment in e. Negative selection s = 0.5 for 4 d followed by varying levels of selection strength as indicated for 14 d. Box plots are shown with line at the median and box ranging from the 25th to the 75th percentile, with whiskers extending to the most extreme value. g, Depiction of CRISPR-based strategy to test selective advantage given to COLO320-DM cells by MYC ecDNA. The arrows indicate regions targeted by sgRNA. h, Genome editing of MYC encoded on ecDNA caused massive decrease in cell numbers that exceeded the impact of intergenic ecDNA editing, which is indicative of strong selection for oncogenes on ecDNA. Data shown as the mean ± s.d. with P values from two-sided t-tests; data from two independent replicates. NS, not significant; NT, nontransfected. i, Quantification of ecDNA numbers per metaphase at 6 and 10 d after CRISPR transfection. Data shown with the median marked with vertical lines, P values from Mann–Whitney U-tests. *P ≤ 0.05; **P ≤ 0.005; ***P ≤ 0.0005; ****P ≤ 0.00005.

