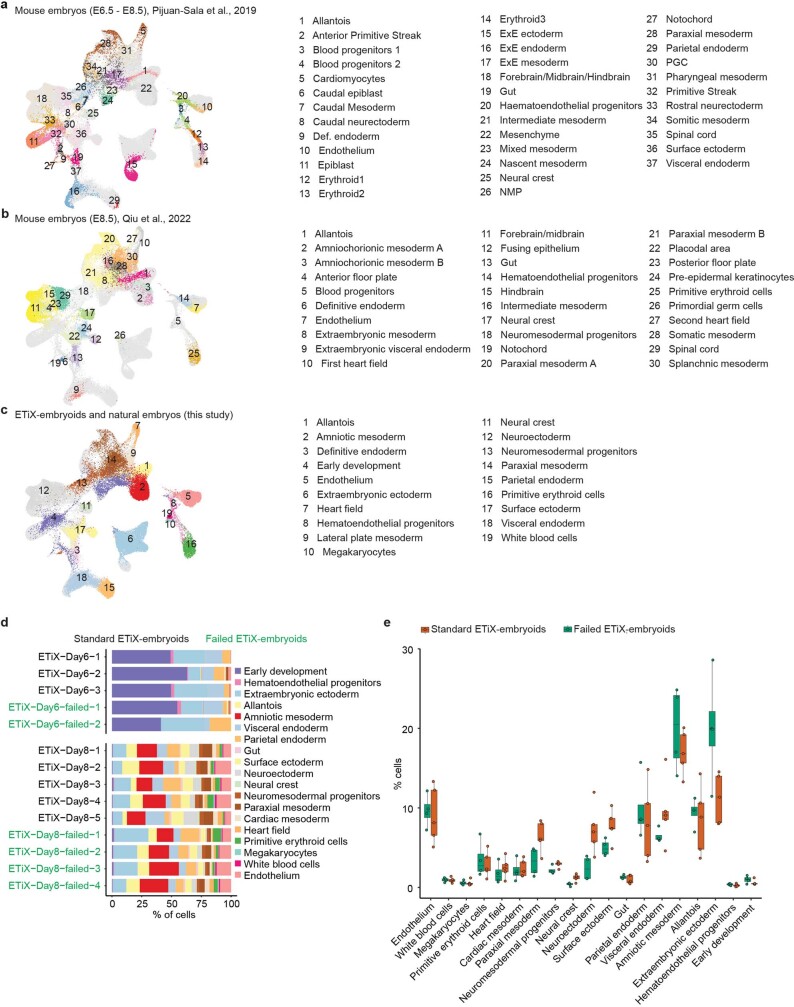
Extended Data Fig. 4. Tiny sci-RNA-seq dataset integrates seamlessly with published single cell sequencing datasets and highlights differences between well-formed and failed ETiX embryoids.
a,b,c. Integration of the tiny sci-RNA-seq dataset generated in this study with two published single cell sequencing mouse datasets17,21. d. Cell type proportions for each individual well-formed (standard) ETiX embryoid and each “failed” ETiX embryoid (classified through aberrant morphology) sequenced at D6 and D8 with tiny sci-RNA-seq (n = 3 for standard ETiX6, 2 for failed ETiX6, 5 for standard ETiX8, 4 for failed ETiX8 from 2 independent experiments). e. Averaged cell type proportions for well-formed (standard) and “failed” ETiX embryoids sequenced at D8 with tiny sci-RNA-seq. Cell type proportions from each individual sample are also plotted. In each boxplot the center line shows the medians; the box limits indicate the 25th and 75th percentiles; the whiskers extend to the 5th and 95th percentiles; the replicates are represented by the dots. (n = 5 for standard ETiX8, 4 for failed ETiX8 from 2 independent experiments)

