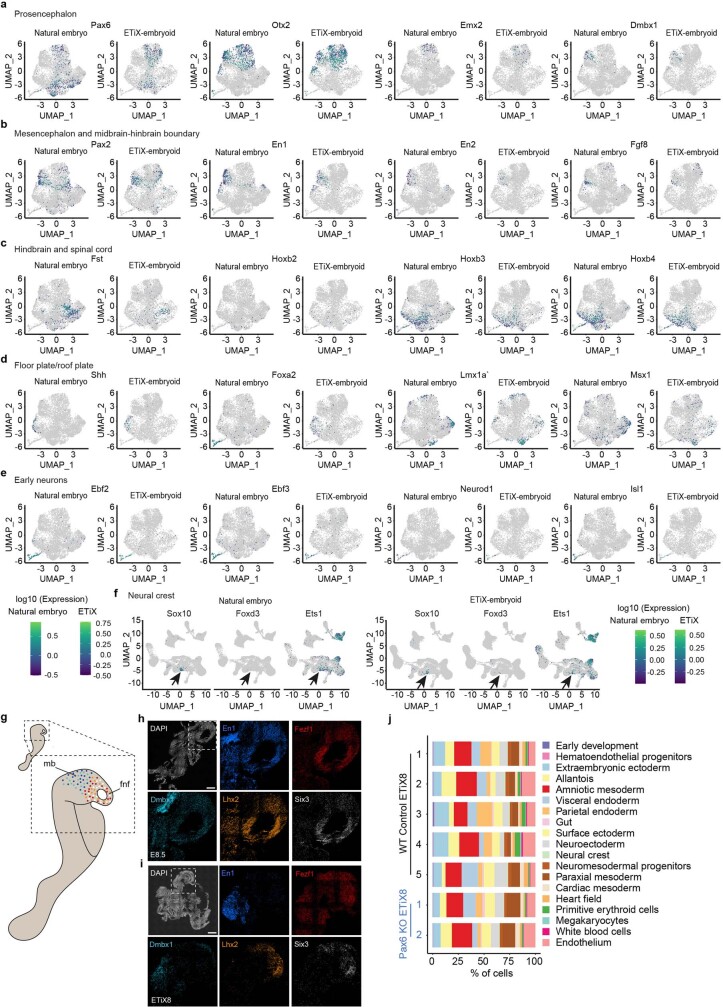
Extended Data Fig. 6. Expression of selected markers for the annotation of neural tissue and localised expression of transcripts revealed by sequential single molecule FISH in natural embryos and ETiX embryoids.
Expression of selected gene markers in annotated clusters shown in Fig. 2g. Gene markers of cell populations representing the prosencephalon (a), mesencephalon and midbrain-hindbrain boundary (b), hindbrain and spinal cord (c) floor plate/roof plate (d), early neurons (e) and neural crest (f) are indicated (tiny sci-RNA-seq). g. Schematic representation of sample sectioning for smFISH and expected expression pattern of selected genes. h,i. smFISH panel of n = 1 natural embryo cultured ex utero from E6.5 to E8.5 (b) and n = 1 day 8 ETiX-embryoid (c) Scale bar = 200 μm. j. The proportion of cell types annotated in Fig. 1f and present in each individual day 8 ETiX embryoid and Pax6 knockout ETiX embryoid sequenced by tiny sci-RNA-seq are shown

