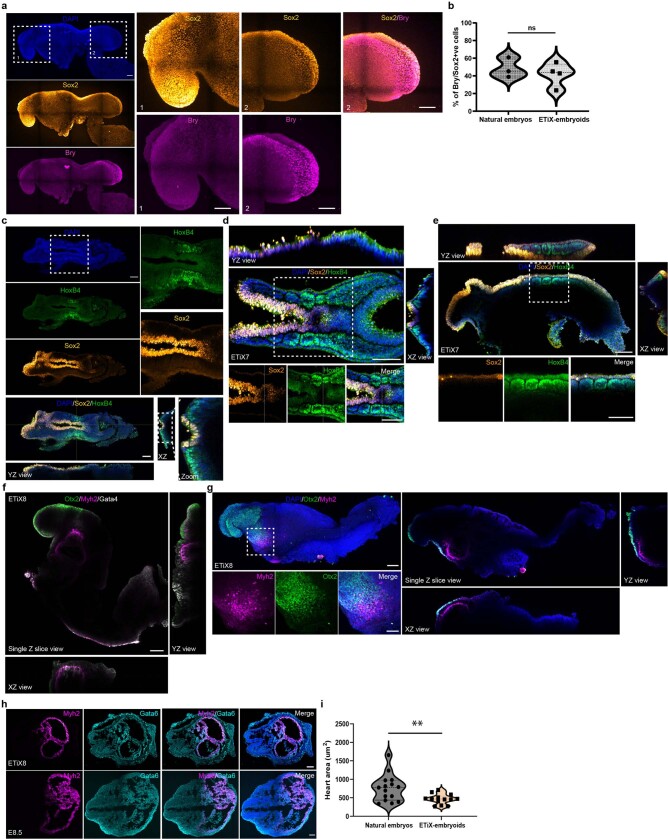
Extended Data Fig. 7. Development of ETiX embryoids mesoderm into somites and cardiac tissue.
a. Lateral view of day 8 ETiX embryoid shown in Fig. 3a, highlighting the individual channels. Square regions are shown magnified on the right. Scale bars, 100 μm. b. Percentages of cells co-expressing BRY and SOX2 in natural embryos and ETiX embryoids. (n = 3 E8.5 embryos and n = 4 ETiX8). Data are presented as violin plots with median and quartiles, each dot represents a sample. Two-sided Mann–Whitney U-test, ns = p > 0.05 (p = 0.5182). c. Dorsal view of day 7 ETiX embryoid shown in Fig. 3c, highlighting the individual channels. YZ and XZ views are also shown (n = 9 ETiX7 from 4 experiments, n = 5 E8.0 embryos). d. Dorsal and e. lateral view of day 7 ETiX embryoid recovered after stationary culture stained to reveal SOX2, HOXB4 and DNA to highlight somite formation flanking the neural tube (n = 9 ETiX7 from 4 independent experiments).YZ and XZ views are also shown. f. Orthogonal views of day 8 ETiX-embryoid shown in Fig. 4g. g. Lateral view of day 8 ETiX embryoid stained to reveal OTX2, MYH2 and DNA to highlight heart formation (n = 8 ETiX8 from 3 independent experiments). YZ and XZ views are also shown. Scale bar for a-d, 100 μm. Scale bar for magnified region, 50 μm. h. Day 8 ETiX embryoid (top) and E8.5 natural embryo (below) sectioned coronally and stained to reveal GATA6 and MYH2 to highlight heart morphogenesis. Scale bar, 200 μm. i. Quantifications of the area of the heart in natural embryos and ETiX mbryoids. The MYH2-positive region was utilised to measure the area of the heart or heart-like structure (n = 3 E8.5 embryos, n = 3 ETiX8). Data are presented as violin plots with median and quartiles. Each dot represents a section of the heart and heart-like region. Two-sided unpaired t-test ** = p ≤ 0.01 (exact p value = 0.01)

