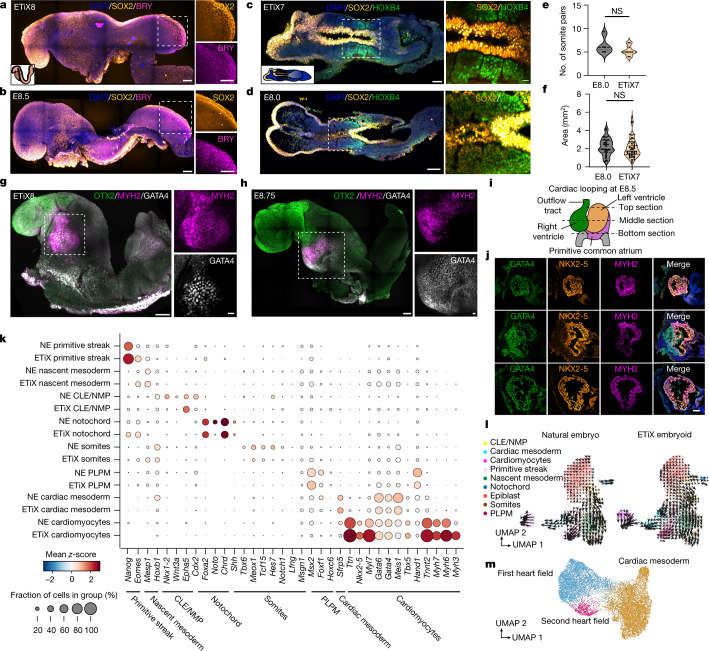
Fig. 4. ETiX embryoids undertake somitogenesis and heart formation.
a,b, Lateral view of day 8 ETiX embryoid (a) and natural E8.5 embryo (b) showing SOX2, Brachyury (BRY) and DNA (DAPI), highlighting NMPs in the tail bud region (n = 5 ETiX8 from 4 experiments, n = 3 embryos). Scale bars, 100 μm. Inset, schematic view. c,d, Dorsal view of day 7 ETiX embryoid after stationary culture (c) and natural E8.0 embryo (d) showing SOX2, HOXB4 and DNA, highlighting somite formation flanking neural tube. Right, magnified view of outlined region containing somites (n = 9 day 7 ETiX embryoids from 4 experiments, n = 5 E8.0 embryos). Inset, schematic view. Scale bars a-d, 100 μm (main image), 50 μm (magnified view a–c), 20 μm (magnified view d). e, Quantification of somite pairs in natural E8.0 embryos and day 7 ETiX embryoids. Violin plots show median and quartiles. Two-sided Mann–Whitney U-test, P = 0.3020. f, Somite area of E8.0 embryos and day 7 ETiX embryoids. Violin plots show median and quartiles. Two-sided Mann–Whitney U-test. P = 0.2717. For e,f, n = 9 day 7 ETiX embryoids from 4 experiments, n = 5 E8.0 embryos. g,h, Day 8 ETiX embryoid (lateral view) (g) and natural E8.75 embryo (h) (lateral view) showing OTX2, MYH2 and GATA4, highlighting heart (n = 8 ETiX8 from 3 experiments, n = 2 natural embryos). Outlined areas are magnified on the right. Scale bars, 100 μm (main image), 20 μm (magnified view). i, Schematic of mouse heart at E8.5, indicating location of sections. j, Coronal sections of ETiX embryoid at day 8 showing GATA4, NKX2-5 and MYH2. Scale bar, 100 μm. n = 3 ETiX8 from 3 independent experiments. k, Dot plot showing levels and proportion of cells expressing indicated genes in indicated tissues from natural embryos (NE) and ETiX embryoids by inDrops scRNA-seq. l, Velocity plots for epiblast and mesodermal derivatives for time series in the inDrops sequencing dataset. m, UMAP of the tiny-sci-RNA-seq dataset, showing cell types in the subclustered cardiac lineage.

