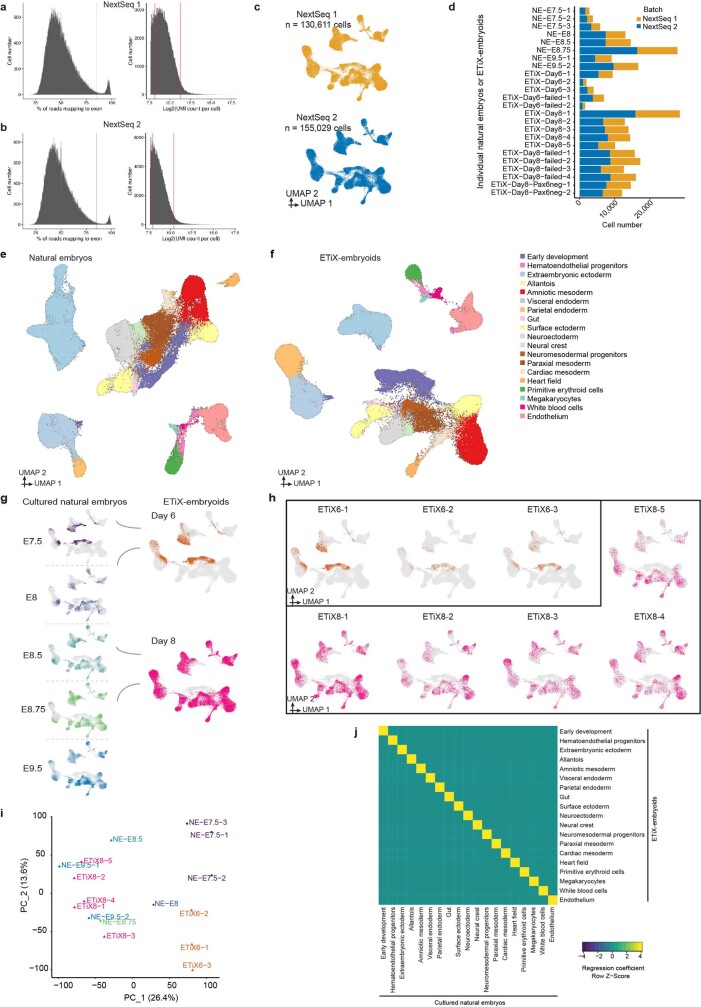
Extended Data Fig. 3. Analysis of ETiX embryoids and natural embryos by tiny sci-RNA-seq.
a,b. Quality control for the first (a) and second replicate (b) of the tiny sci-RNA-seq. Cells with an abnormal percentage of reads mapping to an exon, and too high or too low UMI counts per cell were removed. c. UMAP of the first and second replicate of the tiny sci-RNA-seq. The total number of cells in each dataset is indicated. d. Batch variation for the first and second replicate of tiny sci-RNA-seq. e,f. Separated UMAPs of natural embryos (e) and ETiX embryoids (f) analysed with tiny sci-RNA-seq. g. Contribution of each timepoint to the global UMAP of the tiny sci-RNA-seq. h. Individual UMAPs of standard ETiX embryoids analysed at day 6 and day 8 with tiny sci-RNA-seq. i. PCA analysis of all the natural embryo and standard ETiX- mbryoid samples analysed with tiny sci-RNA-seq. j. Correlation matrix following a nonnegative least-squares (NNLS) regression analysis showing global level of similarity across all identified tissues in natural embryos (columns) in comparison to ETiX embryoids (rows) in the samples analysed by tiny sci-RNA-seq

