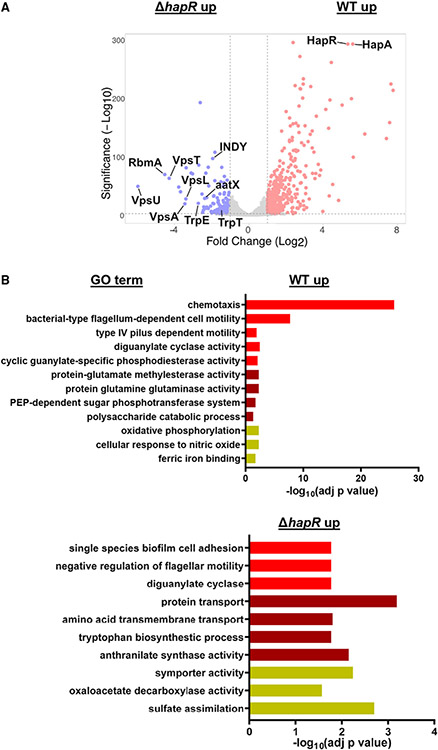
Figure 3. HCD quorum sensing regulates amino acid and carbohydrate metabolism in addition to biofilm formation.
(A and B) Volcano plot (A) and GO analysis (B) of genes differentially expressed in 8-h LB cultures of WT V. cholerae and a ΔhapR mutant. Analysis is based on an RNA-seq experiment with bioiogical triplicates in which the fold change in expression was required to be greater than or equal to 2 and adjusted p < 0.05 was taken to be significant. The calculated adjusted p value is shown. See also Figures S4 and S5.

