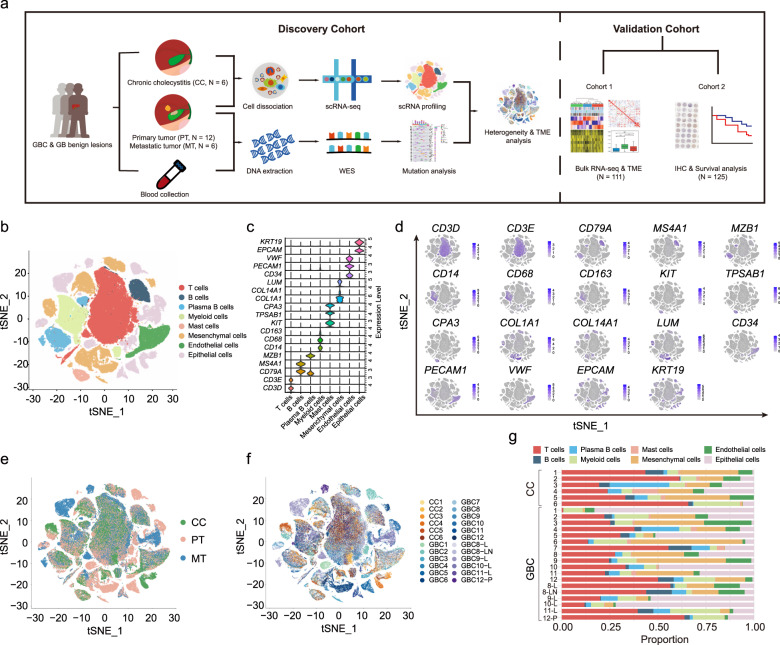
Fig. 1. Overview of scRNA-seq analysis across patient-derived gallbladder carcinoma (GBC) samples and non-malignant gallbladder (GB) samples.
a Workflow for sample collection, processing, sequencing, data analysis, and external validation. b t-SNE plot visualizing 42 distinct clusters encompassing 140,870 cells from all samples (n = 24), colored by cell type (n = 8). c Violin plots showing expression levels of marker genes for each cell type. d t-SNE plots visualizing expression levels of cell-type gene signatures among identified cell clusters. e t-SNE plot visualizing cell clusters colored by tissue of origin. CC chronic cholecystitis; PT primary tumor; MT metastatic tumor. f t-SNE plot visualizing cell clusters colored by sample. L Liver; LN lymph node; P peritoneum. g Horizontal bar charts showing the relative abundance of various cell types in each sample.

