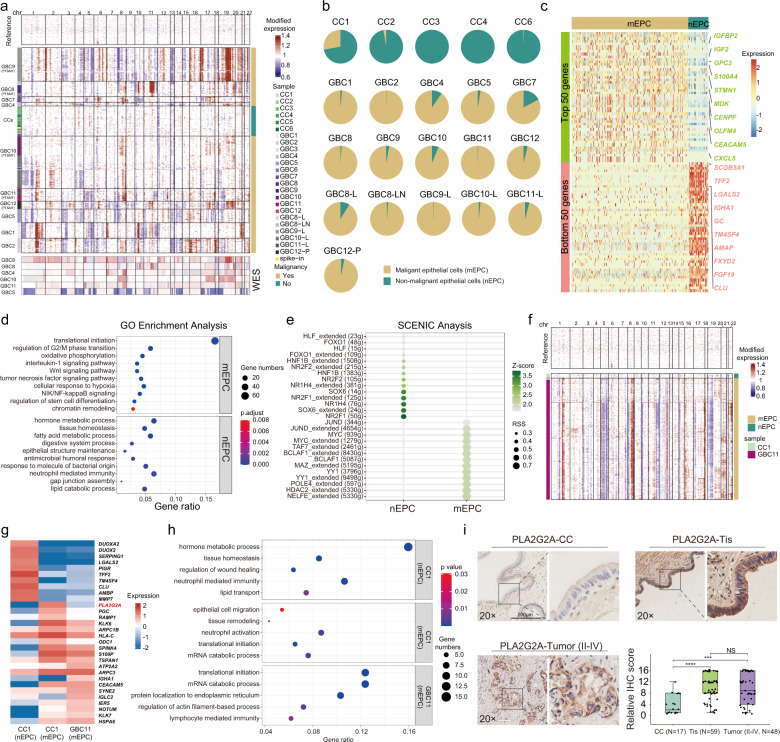
Fig. 2. scRNA-seq analysis of malignant epithelial cells (mEPCs) and non-malignant epithelial cells (nEPCs).
a The landscape of inferred large-scale copy number variations (CNVs) for EPCs among all samples, paired with CNV features revealed by whole-exome sequencing (WES) in six GBC samples. Chromosomal locations are displayed on the top. The left annotation bar indicates sample IDs. The right bar indicates CNV-based categorization of epithelial cells. b Pie charts showing the relative abundance of mEPCs and nEPCs across samples with EPC counts ≥ 30 (n = 21). c Heatmap showing top 50 differentially expressed genes (DEGs) between mEPCs and nEPCs. d Dot plots showing differentially enriched GO terms in mEPCs versus nEPCs. e Dot plots showing activities of transcription factors among mEPCs versus mEPCs. f The landscape of inferred CNVs for EPCs from CC1 and GBC11 (from the same patient), showing a small fraction of cells inferred as mEPCs in CC1. g Heatmap showing top-ranking DEGs for CC1-originated nEPCs, CC1-originated mEPCs, and GBC11-originated mEPCs. h Dot plots showing significantly enriched GO terms across CC1-originated nEPCs, CC1-originated mEPCs, and GBC11-originated mEPCs. i PLA2G2A expression across inflamed gallbladders (n = 17), GBCs in situ (Tis; n = 59), and GBCs (TNM II-IV; n = 48), illustrated by typical IHC staining images (scale bars, 200 μm; 20×) and boxplots (bottom-right) that compared PLA2G2A expression levels between three groups (Wilcoxon rank-sum test; ***P < 0.001, ****P < 0.0001; NS not significant).

