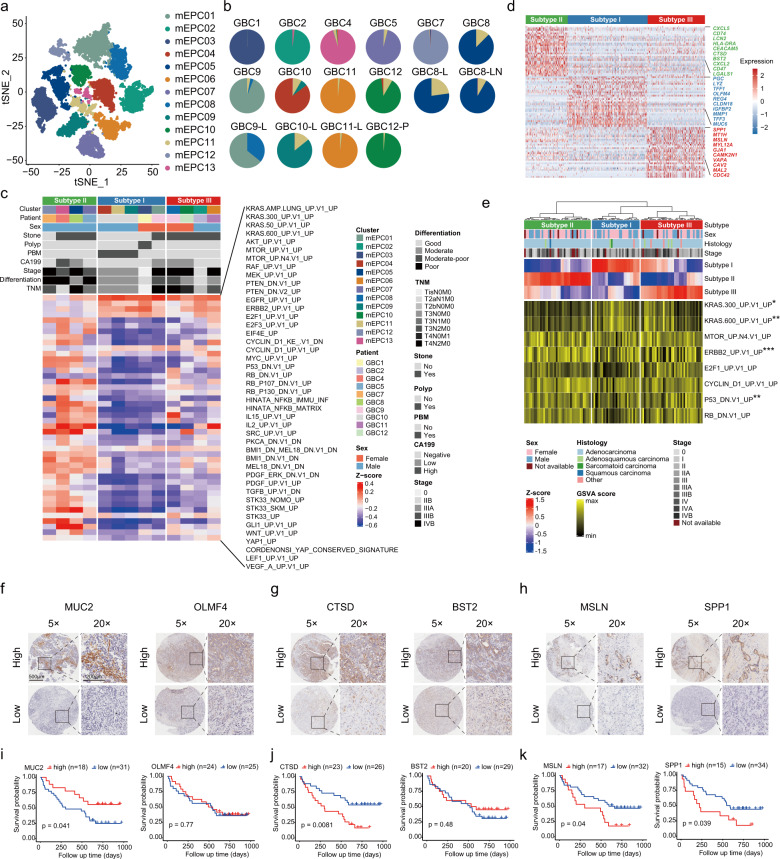
Fig. 3. Characterization of three subtypes of mEPCs based on 10× scRNA-seq.
a t-SNE plot showing mEPCs colored by clusters (n = 13). b Pie charts showing the relative abundance of mEPC clusters (colored in line with a) across tumor samples (n = 16, excluding two samples with EPC counts < 30). c Heatmap showing three subtypes of mEPCs classified by hierarchical clustering based on GSVA analysis (MSigDb_C6 oncogenic signatures), with corresponding clinicopathological features displayed. d Heatmap showing top-ranking DEGs for three subtypes of mEPCs. e Heatmap showing the assignment of scRNA-seq-defined mEPC subtypes by analyzing the bulk RNA-seq data from an external GBC cohort (n = 111), based on GSVA analysis (MSigDb_C6 oncogenic signatures). P values for pathways with a significant enrichment are displayed (one-way ANOVA test; **P < 0.01, ***P < 0.001). f–h Representative IHC staining images of markers for subtype I (MUC2, OLMF4), subtype II (CTSD, BST2), and subtype III (MSLN, SPP1) by using our GBC tissue microarray cohort (n = 49), respectively. Scale bars, 500 μm, 5×; 200 μm, 20×. i–k Kaplan–Meier curves of overall survival when stratifying patients by high or low expression of mEPC subtype markers. P values were calculated by log-rank test.

