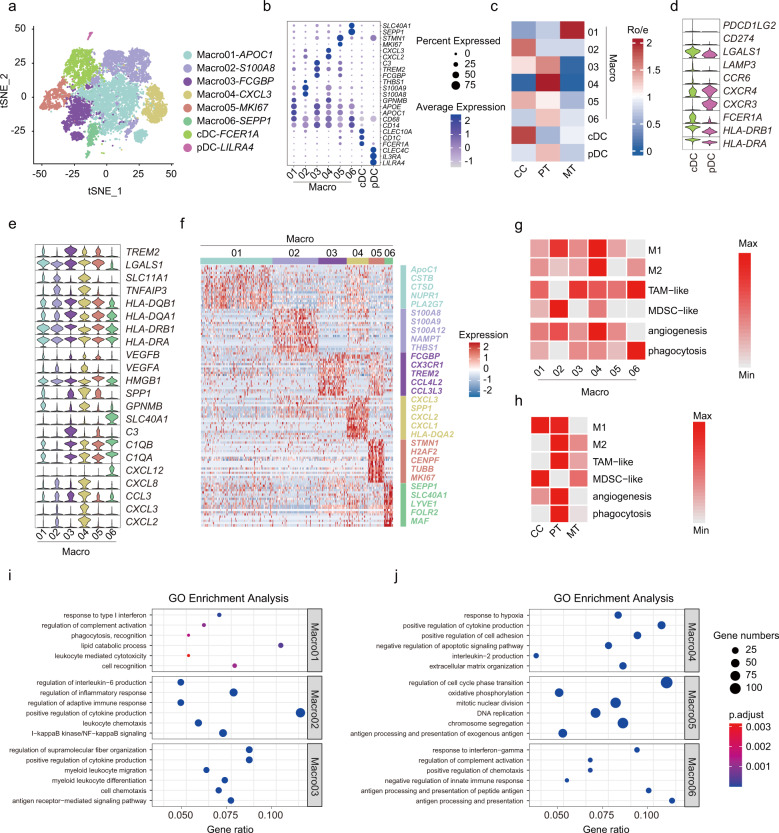
Fig. 4. Characterization of myeloid cells by 10× scRNA-seq.
a t-SNE plot showing eight color-coded myeloid cell clusters, including six macrophage clusters and two dendritic cell clusters. b Bubble heatmap showing expression levels of marker genes across macrophage and dendritic cell subsets. c Heatmap showing preferential enrichment of eight myeloid cell clusters across CCs, PTs, and MTs. Ro/e > 1 indicates significant enrichment. d Violin plot showing expression of representative gene signatures among dendritic cell subsets. e Violin plots showing expression of functional gene sets across macrophage clusters (from right top to bottom: innate host defenders against microbes; HLA molecules; markers for angiogenesis and hypoxia; complement components; inflammatory chemokines). f Heatmap showing top-ranking DEGs for each macrophage subset. g Heatmap displaying functional assignment of each macrophage cluster. TAM, tumor-associated macrophage; MDSC, myeloid-derived suppressor cells. h Heatmap showing the relative abundance of functional macrophage subsets across CCs, PTs, and MTs. i, j Dot plots showing typically significantly enriched GO terms across macrophage clusters.

