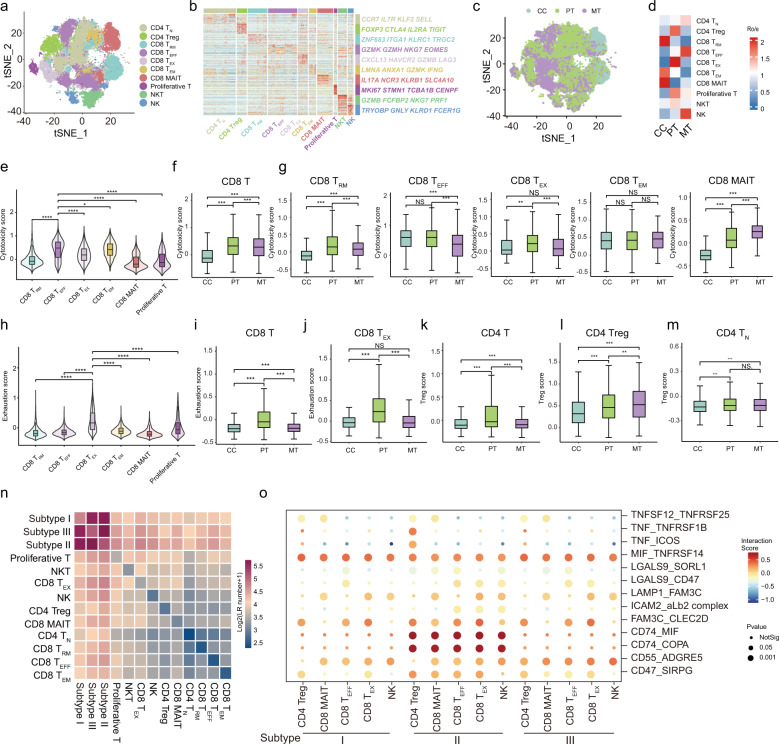
Fig. 5. Clustering and functional analysis of T Cells and NK cells.
a t-SNE plot showing color-coded clusters of T cells (n = 8) and NK cells (n = 2). TN, naive T cells; Treg, regulatory T cells; TRM, tissue-resident memory T cells; TEFF, effector T cells; TEM, effector memory T cells; MAIT, mucosal-associated invariant T cells. b Heatmap showing transcription levels of typical gene signatures across different T cell and NK cell subsets. c t-SNE visualization of T cells and NK cells colored by tissue of origin (CCs, PTs, or MTs). d Heatmap showing the preferential enrichment of T cell and NK cell clusters across CCs, PTs, and MTs. Ro/e > 1 indicates significant enrichment. e Violin plot displaying cytotoxicity scores for CD8+ T cell subsets, by comparing CD8+ TEFF cells with other CD8+ T cell clusters. *P < 0.05; ****P < 0.0001. f Boxplots comparing cytotoxicity scores for CD8+ T cells between CCs, PTs, and MTs. ***P < 0.001. g Boxplots comparing cytotoxicity scores for CD8+ TRM, CD8+ TEFF, CD8+ TEX, CD8+ TEM, and CD8+ MAIT cell subsets between CCs, PTs, and MTs, respectively. NS, no significance; **P < 0.01; ***P < 0.001. h Violin plot showing exhaustion scores for CD8+ T cell subsets, by comparing CD8+ TEX cells with other CD8+ T cell subsets. ****P < 0.0001. i Boxplots comparing exhaustion scores for CD8+ T cells between CCs, PTs, and MTs. ***P < 0.001. j Boxplots comparing exhaustion scores for CD8+ TEX cells between CCs, PTs, and MTs. ***P < 0.001; NS, no significance. k–m Boxplots comparing regulatory T (Treg) scores for CD4+ T cells, CD4+ Treg cells, and CD4+ TN cells between CCs, PTs, and MTs, respectively. **P < 0.01; ***P < 0.001; NS, no significance. n Heatmap showing the strength of potential ligand-receptor (LR) interactions between mEPC subtypes and T cell/NK cell subsets predicted by CellphoneDB. o Bubble plot showing representative ligand-receptor pairs between mEPC subtypes and T cell/NK cell subsets. Dot size indicates P value, colored based on interaction score. P values were calculated by Wilcoxon rank-sum test for e–m.

