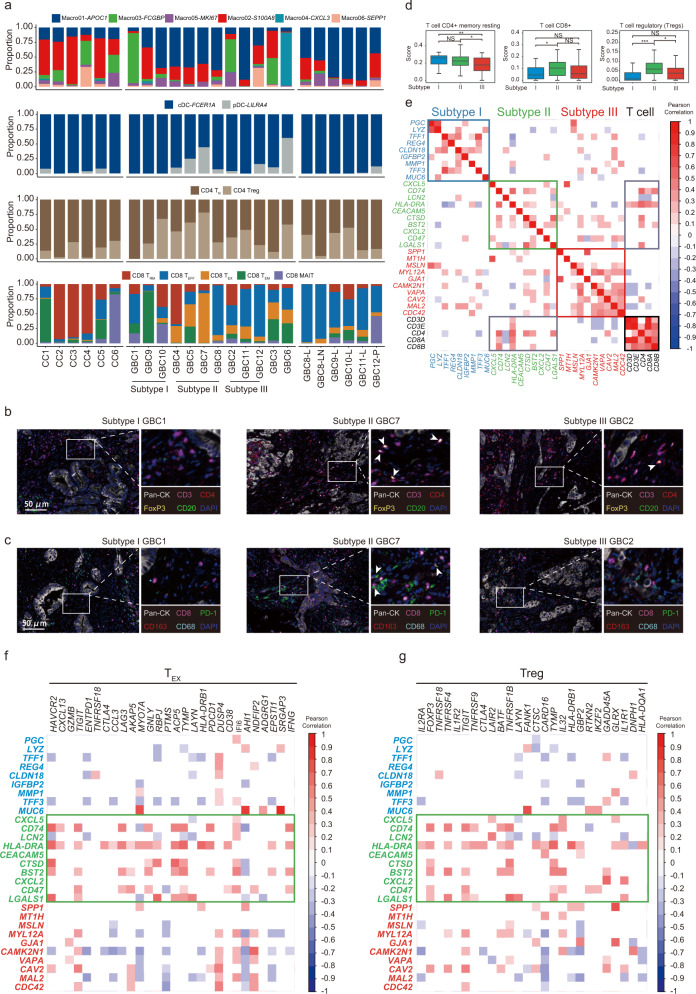
Fig. 6. Landscape of innate and adaptive immune microenvironment.
a Bar charts showing the relative abundance of various immune cell subsets (from top to bottom: macrophages, DCs, CD4+ T cells, and CD8+ T cells) in each sample of our scRNA-seq cohort. b, c Representative immunofluorescence staining for epithelial markers (pan-CK) and immune cell markers (CD3, CD4, CD8, CD20, CD163, PD-1, and FoxP3) across samples of different mEPC subtypes. Scale bars, 50 μm. CD4+FoxP3+ cells are highlighted by arrows in b, and arrows in c indicate CD8+PD-1+ cells. d Boxplots comparing CIBERSORT scores of typical T cell subsets between differentially assigned subtypes of GBCs, based on external bulk RNA-seq data (n = 111). e Correlation matrix showing the relationship between mEPC subtype gene signatures and T cell marker genes, based on external bulk RNA-seq data (n = 111). f, g Correlation matrix showing the relationship between mEPC subtype gene signatures and CD8+ TEX cell marker genes (f) or CD4+ Treg marker genes (g), based on external bulk RNA-seq data (n = 111).

