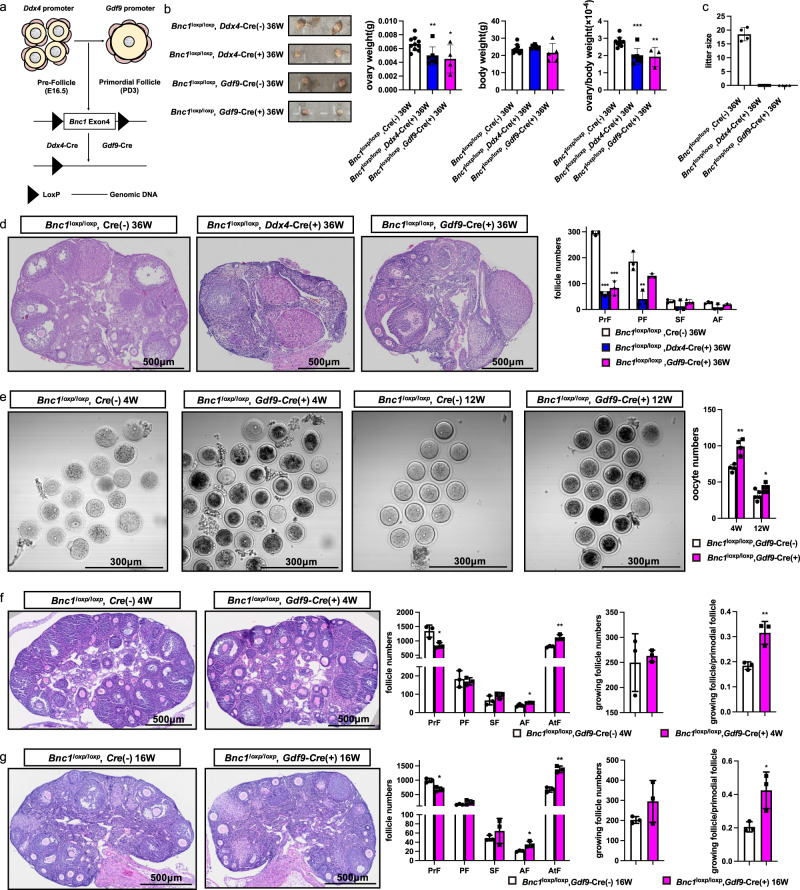
Fig. 2. Bnc1 affects follicle development by influencing oocytes.
a Schematic representation of the deletion of Bnc1 exon 4 in oocytes of pre-follicles, PrFs by using Ddx4 and Gdf9-Cre transgenic. b Ovary weight, body weight and ovary weight/body weight ratios of Bnc1loxP/loxP, Cre (−) (n = 9), Bnc1loxP/loxP, Ddx4-Cre (+) (n = 7, p value = 0.0069 for ovary weight, p value = 0.2647 for body weight, p value = 0.0003 for ovary weight/body weight) and Bnc1loxP/loxP, Gdf9-Cre (+) (≥3, p value = 0.0179 for ovary weight, p value = 0.2835 for body weight, p value = 0.0029 for ovary weight/body weight) mice at 36 weeks. c Average litter sizes of Bnc1loxP/loxP, Cre (−) (n = 4), Bnc1loxP/loxP, Ddx4-Cre (+) (n = 5, p value < 0.0001) and Bnc1loxP/loxP, Gdf9-Cre (+) (n = 4, p value < 0.0001) female mice. d Comparison of follicle numbers of Bnc1loxP/loxP, Cre (−) (n = 3), Bnc1loxP/loxP, Ddx4-Cre (+) (n = 3, p value < 0.0001 for PrFs, p value = 0.0060 for PFs, p value = 0.2081 for SFs and p value = 0.0667 for AFs) and Bnc1loxP/loxP, Gdf9-Cre (+) (n = 3, p value = 0.0002 for PrFs, p value = 0.0620 for PFs, p value = 0.7357 for SFs and p value = 0.1135 for AFs) mice at 36 weeks. Scale bar = 500 μm. e GV oocytes obtained from Bnc1loxP/loxP, Cre (−) and Bnc1loxP/loxP, Gdf9-Cre (+) mice at 4 (n = 4) and 12 (n = 4) weeks old (p value = 0.0022 for 4 weeks old, p value = 0.0398 for 12 weeks old). f Comparison of follicle numbers of Bnc1loxP/loxP, Cre (−) and Bnc1loxP/loxP, Gdf9-Cre (+) mice at 4 weeks (n = 3, p value = 0.7145 for growing follicles, p value = 0.0091 for growing follicles/PrFs, p value = 0.0206 for PrFs, p value = 0.6640 for PFs, p value = 0.1959 for SFs, p value = 0.03219 for AFs and p value = 0.0065 for AtFs). g Comparison of follicle numbers of Bnc1loxP/loxP, Cre (−) and Bnc1loxP/loxP, Gdf9-Cre (+) mice at 16 weeks (n = 3, p value = 0.2046 for growing follicles, p value = 0.0287 for growing follicles/PrFs, p value = 0.0074 for PrFs, p value = 0.1718 for PFs, p value = 0.3858 for SFs, p value = 0.0219 for AFs and p value = 0.0011 for AtFs). Scale bar = 500 μm. The error bars indicate the mean values ± SDs, unpaired t test, two-tailed, *p value < 0.05, **p value < 0.01 and ***p value < 0.001. Source data are provided as a Source Data file.

