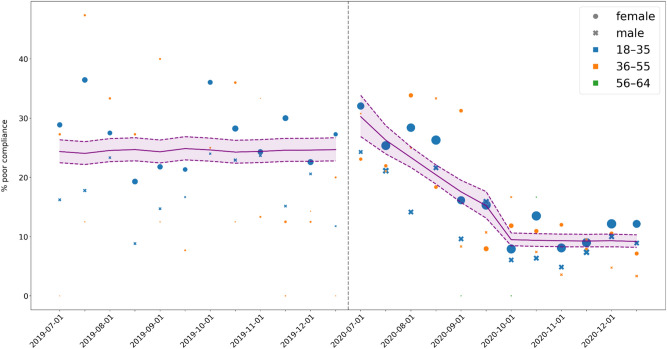
Figure 5.
The MMI model by starting date of treatment. The purple line gives the point estimates of expected poor compliance while the purple shaded area is the 95% confidence band. Each point indicates the mean poor compliance of the given group, whereby the size of the point is proportional to the number of patients contained within that group. Points with fewer than 5 patients were excluded from the figure. The dashed vertical line indicates the gap between the two segments.

