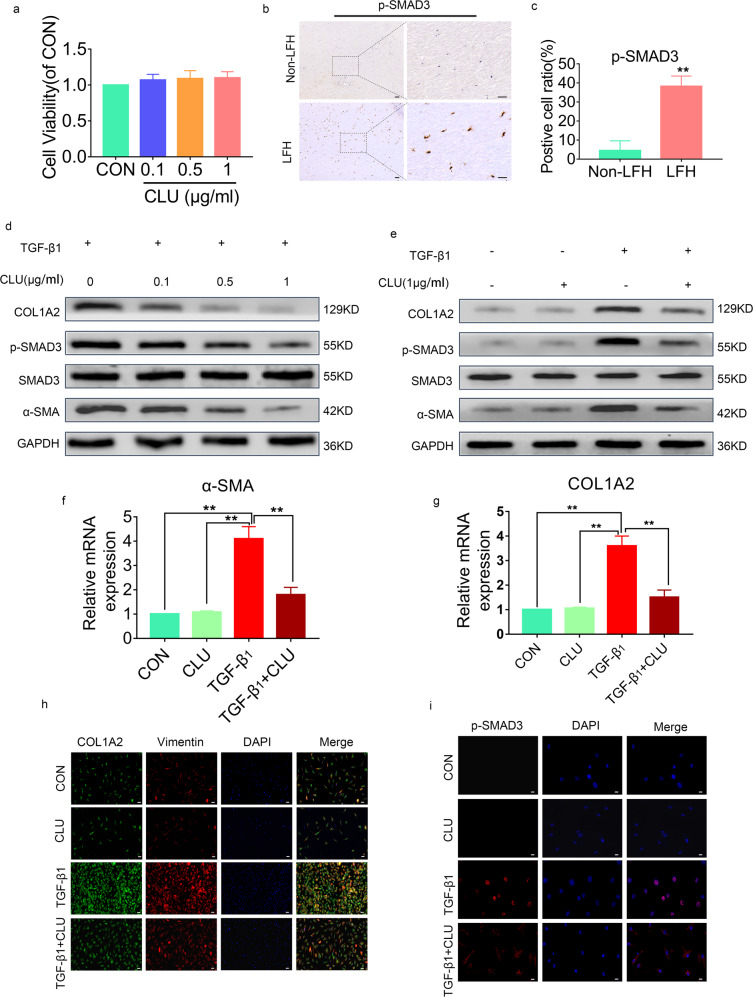
Fig. 4. CLU inhibits TGF-β1-induced SMAD3 signaling.
a Cell viabilities were evaluated by the CCK8 assay (n = 3). Data are shown as the mean ± SD. b Immunohistochemical staining of p-SMAD3 in LF tissues from the two groups (n = 6). The scale bar indicates 100 μm. c Positive cell ratio for p-SMAD3. Data are expressed as the mean ± S.D. **P < 0.01. d Western blot analysis showing the protein expression levels of SMAD3 signaling in LF cells after treatment with 5 ng/mL TGF-β1 and different concentrations of CLU for 24 h. e SMAD3 signaling protein levels in LF cells after different treatments for 24 h. f, g Quantitative RT‒PCR analysis showing the gene expression levels of α-SMA and COL1A2 in LF cells from different treatment groups. Relative mRNA expression levels from control group cells were set as 1. Data are shown as the mean ± S.D. *P < 0.05, **P < 0.01. h Immunofluorescence staining of COL1A2 and Vimentin under different treatments for 24 h. COL1A2 (green), Vimentin (red), DAPI (blue); the scale bar indicates 50 μm. i Effects of CLU on p-SMAD3 nuclear translocation in LF cells. The cells had different treatments for 24 h. p-SMAD3 (red), DAPI (blue), the scale bar indicates 20 μm.

