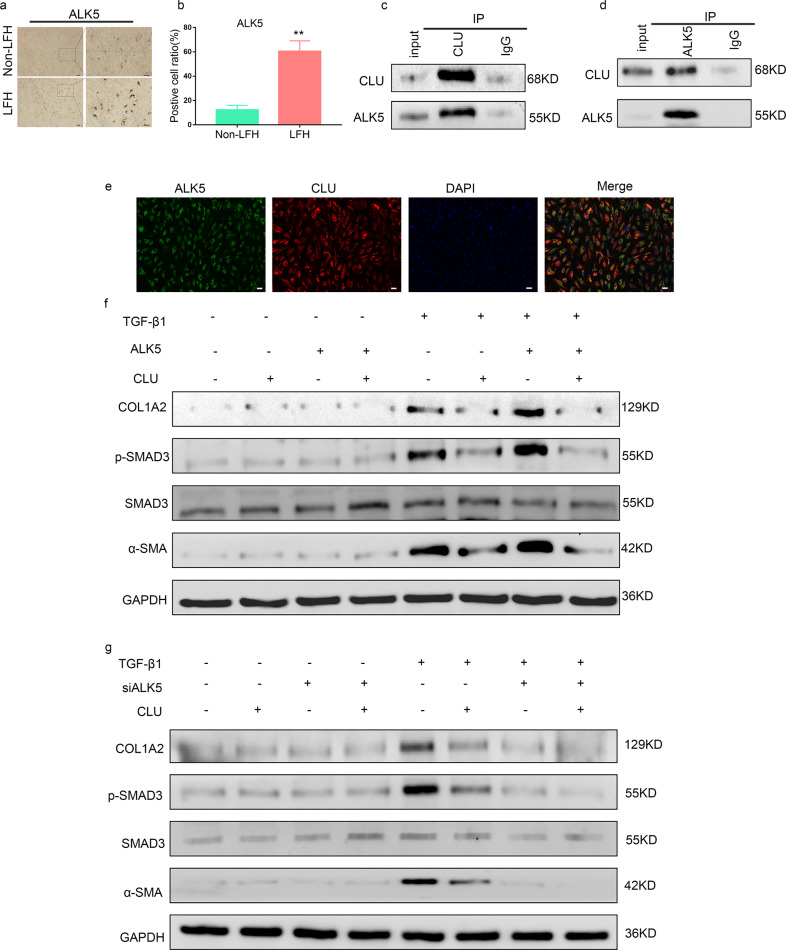
Fig. 5. CLU inhibits TGF-β1-induced SMAD3 signaling by binding to ALK5.
a Immunohistochemical staining of ALK5 in LF tissues from the two groups (n = 6). The scale bar indicates 100 μm. b Quantitative analysis of the positive cell ratio for ALK5. Data are shown as the mean ± S.D. **P < 0.01. c, d Reciprocal immunoprecipitation showing the interaction between ALK5 and CLU. LF cells were treated with 5 ng/ml TGF-β1 for 24 h before performing Co-IP analysis. e Representative images from the immunofluorescence assay showing the colocalization of ALK5 and CLU after treatment with 5 ng/ml TGF-β1 using specific antibodies. ALK5 (green), CLU (red) and DAPI (blue). The scale bar indicates 50 μm. f Western blot analysis showed the effects of ALK5 overexpression on the SMAD3 signaling pathway protein levels upon treatment with TGF-β1 and CLU or not. g Effects of siALK5 on the protein levels of the SMAD3 signaling pathway upon treatment with TGF-β1 and CLU or not.

