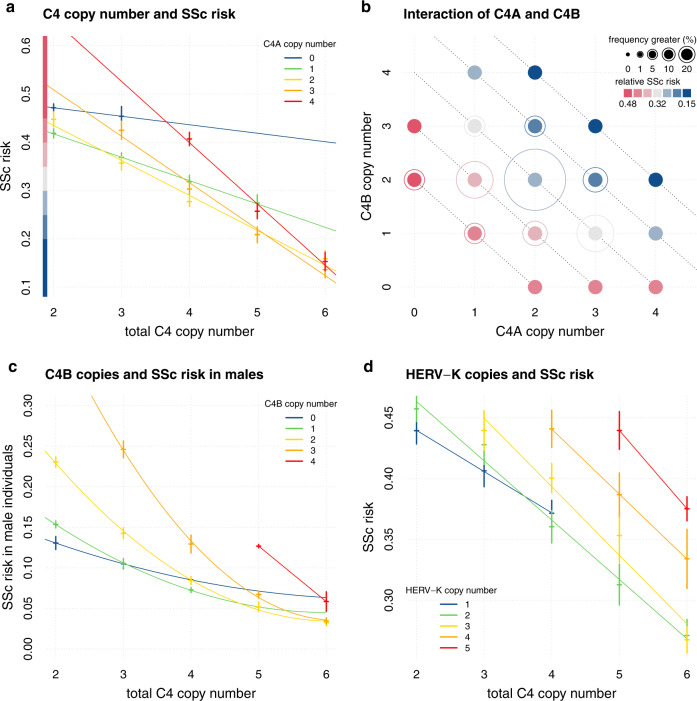
Fig. 1. C4 and HERV-K copy numbers and Systemic Sclerosis risk.
a depicts relative systemic sclerosis (SSc) risk vs total C4 copy number stratified by C4A CN. The SSc risk score is calculated per individual as the sum of effect sizes (betas) multiplied with the design matrix. Betas of C4A, C4B and C4A:C4B were taken from the most complex model “d” (see “Methods”). Crosses are calculated as average relative risk per rounded C4 CN + /− 2 standard deviations (y axis). Linear regression lines are colored by C4A CN and drawn to visualize the interaction effect of C4A and C4B. The y axis contains a color code to aid a comparison with (b). b depicts the relative SSc risk of combinations of C4A and C4B CNs. Relative risk is calculated as in (a). Outer circles are drawn according to population frequency ranges of each C4A, C4B combination and highlight more common combinations. Diagonal dotted lines help to identify combinations of equal total C4 CN. c depicts relative SSc risk in male individuals vs total C4 CN stratified by C4B CN. Relative risk is calculated like in (a) using effect sizes of C4A, C4B, C4A:C4B, Sex:C4A, and Sex:C4B. Crosses are calculated as average relative risk per rounded C4 CN + /− 2 standard deviations (y axis). Cubic regression lines are colored by C4B CN and drawn to visualize the interaction effect of C4A and C4B. d depicts relative SSc risk vs total C4 CN stratified by HERV-K CN. Relative risk is calculated like in (a) using effect sizes of C4A, C4B, C4A:C4B, HERV-K:C4A, and HERV-K:C4B. Crosses are calculated as average relative risk per rounded C4 CN + /− 2 standard deviations (y axis). Linear regression lines are colored by HERV-K CN.

