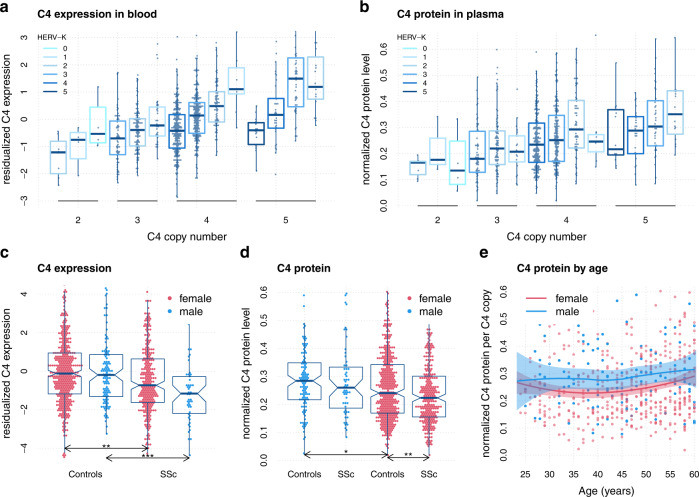
Fig. 2. C4 expression and C4 protein concentrations in whole blood.
a depicts residualized total C4 expression levels by total C4 copy number (CN) stratified by HERV-K CN. C4 expression is calculated as the sum of C4A and C4B expression as obtained by RNA-Sequencing. The residualized expression has been calculated by regressing out 20 (18) principal components for controls and cases, respectively. Data has been grouped by rounded C4 and HERV-K CN dosage. b depicts normalized C4 protein levels in plasma by total C4 CN stratified by HERV-K CN. C4 protein levels have been normalized across 10+ laboratory sites. c depicts residualized total C4 expression levels (like in a) for SSc and controls, stratified by sex. Significant comparisons are highlighted by asterisk (*P < 0.05, **P < 0.01, ***P < 0.001). d depicts normalized C4 protein levels (like in b) for SSc and controls, stratified by sex. Significant comparisons are highlighted by asterisk (*P < 0.05, **P < 0.01, ***P< 0.001). e depicts normalized C4 protein levels in blood from 119 adult men (blue) and 447 adult women (red) as a function of age with locally estimated scatterplot smoothing (LOESS). Protein levels are normalized to the number of C4 gene copies in an individual’s genome. All boxplot are drawn with default settings in R 4.0.3: lines are defined as first, second and third quartile (Q1, Q2, Q3), whiskers depict the most extreme data points within Q1–1.5 interquartile range (IQR), and Q3 + 1.5 IQR. Boxplot notches are defined as 95% confidence interval of the median.

