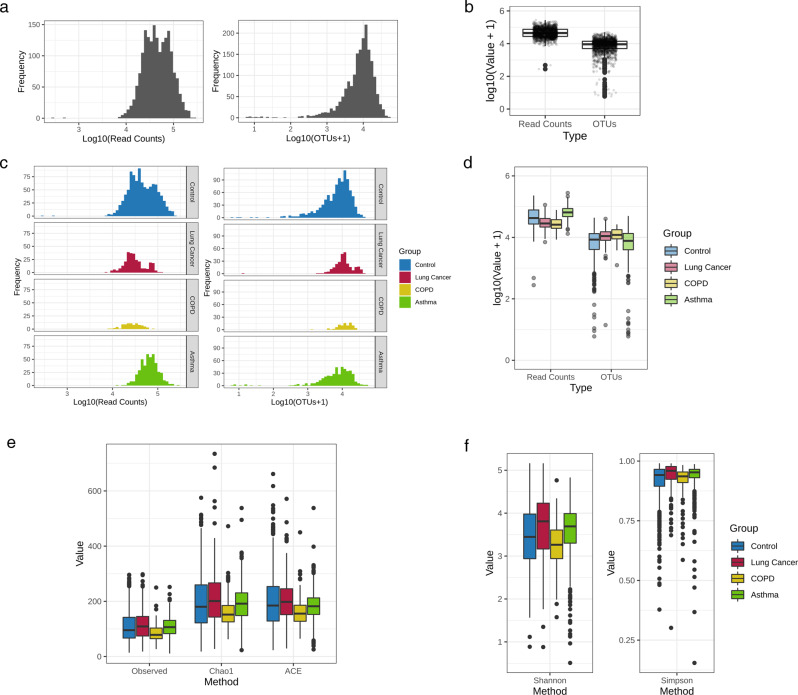
Fig. 1. Raw NGS read counts, profiled OTU counts, and alpha diversity of serum clinical samples.
Frequency distribution of a all clinical serum samples and b the samples in the control, lung cancer, COPD, and asthma groups based on their read counts and number of OTUs. A box-plot was also constructed to visualize the read counts and number of OTUs in c all samples and d the individual clinical groups. Alpha diversity was assessed between the four clinical groups through e species richness (observed, Chao1, and ACE), and f species diversity (Shannon and Simpson indices) within each sample in a given group expressed as a box-plot.

