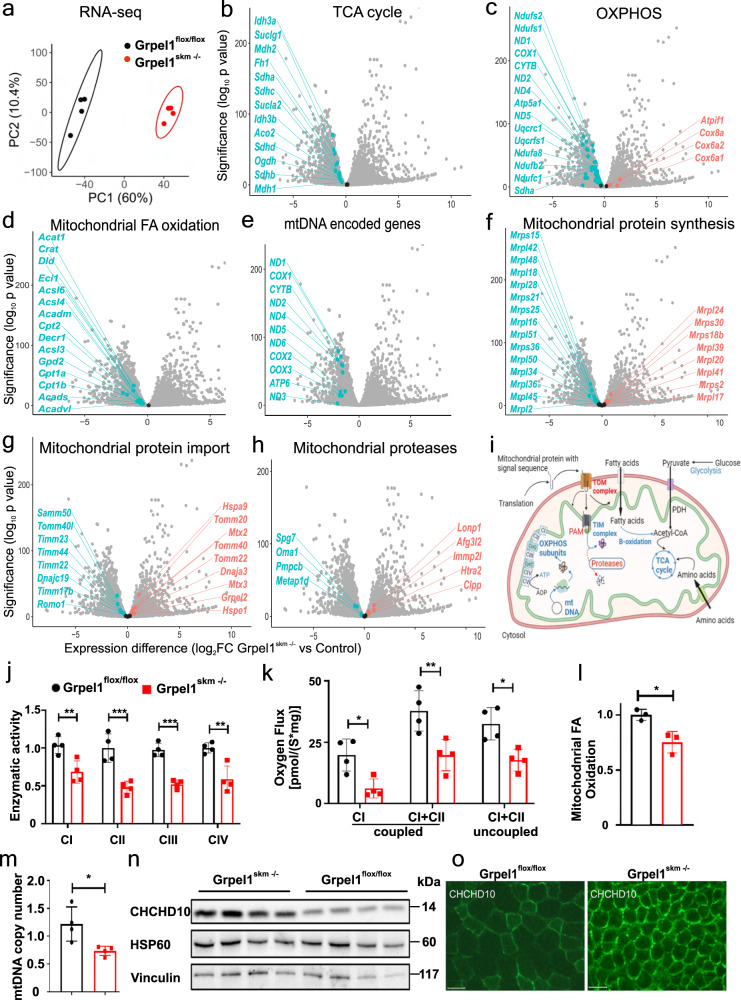
Fig. 2. Intramitochondrial response to Grpel1 loss in skeletal muscle.
a Principal component analysis (PCA) for RNA sequencing data from QF of Grpel1skm−/− and control mice (n = 4 per genotype). b–h Volcano plots showing the changes in gene expression in different mitochondrial pathways. i Graphical representation of the altered mitochondrial pathways in Grpel1skm−/− muscle. Red color (arrows and text) indicates upregulation whereas the blue color (arrows and text) indicates downregulation (Created with BioRender.com). j Enzymatic activity of mitochondrial respiratory chain complexes, in mitochondria isolated from QF muscle, and normalized to control (n = 4 per genotype). k CI‐coupled, CI + CII‐coupled and uncoupled (with FCCP) respiration in QF muscle homogenates (n = 4 per genotype). l Quantification of fatty acid oxidation capacity of mitochondria, isolated from QF muscle, and normalized to control (n = 3 per genotype). m Quantification of mtDNA copy number in QF muscle of Grpel1skm−/− and control mice (n = 4 per genotype). n Immunoblot of total protein lysates from QF muscle with CHCHD10 and HSP60 antibodies. o Representative images of immunohistochemistry staining of QF muscle with CHCHD10 antibody. Scale bar is 100 µm.

