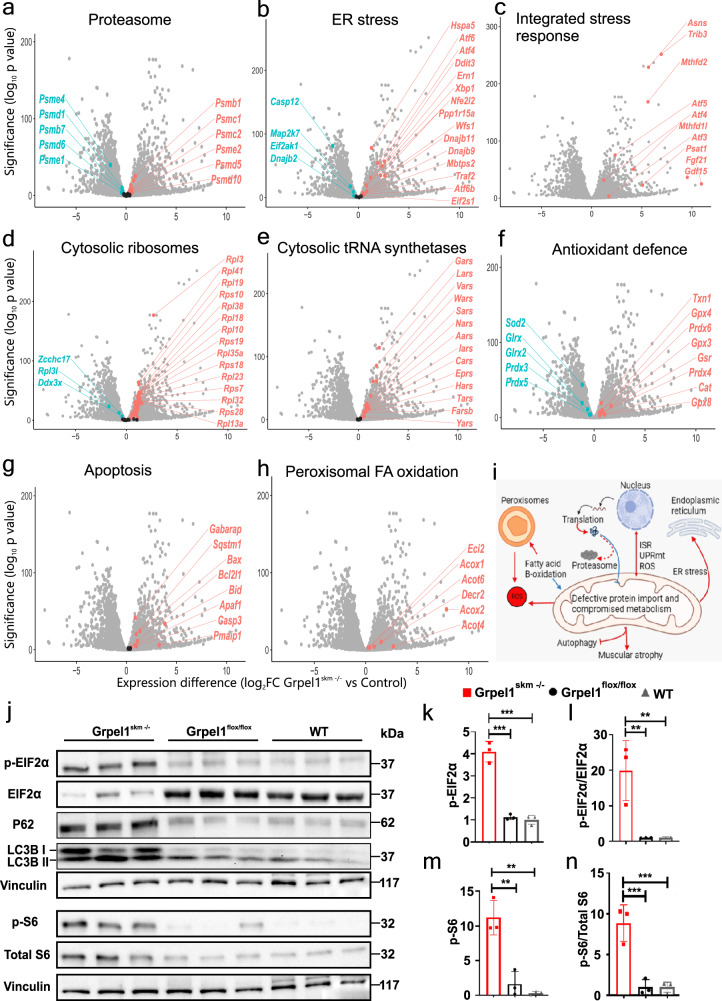
Fig. 3. Organelle crosstalk in response to Grpel1 loss in skeletal muscle.
a–h Volcano plots for different pathways indicating changes in gene expression due to loss of Grpel1 in skeletal muscle. i Graphical representation of crosstalk between dysfunctional mitochondrial, due to loss of Grpel1, with other cellular organelles. Red color (arrows) indicates upregulation whereas the blue color (arrows) indicates downregulation (Created with BioRender.com). j Immunoblot of total protein lysates from QF muscle of Grpel1skm−/−, Grpel1flox/flox and WT mice. k–n Quantification of p-EIF2α level, p-EIF2α/total EIF2α ratio, p-S6 level and p-S6/total S6 ratio in skeletal muscle of Grpel1skm−/−, Grpel1flox/flox and WT mice. Vinculin was used as the loading control (n = 3 per genotype).

