
Figure 4.
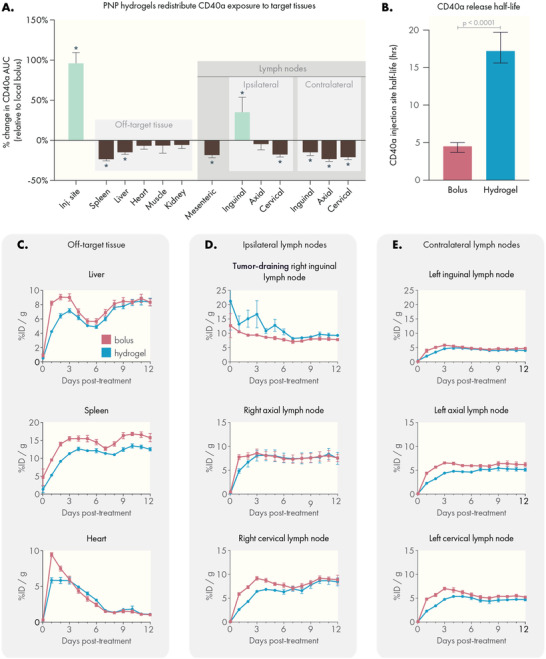
PNP hydrogels increase drug exposure to target tissues and reduce exposure in off‐target tissues compared to local bolus. A) Percent change in area under the curve (AUC) values for each tissue relative to local bolus administration. AUCs were derived from the PET pharmacokinetic data. Statistical comparisons indicate a significant difference from local bolus AUC, performed as multiple unpaired t‐tests. Corrections for multiple comparisons were performed using the FDR approach (Q = 1%). B) CD40a retention half‐life at the injection site, estimated from a one‐phase decay fit of PET data. Comparison performed using the extra sum‐of‐squares F test. PET pharmacokinetic curves tracking CD40a concentration in C) off‐target tissues, D) ipsilateral lymph nodes (including the tumor‐draining lymph node), and E) off‐target contralateral lymph nodes. N = 4 for both groups, data shown as mean and SEM.