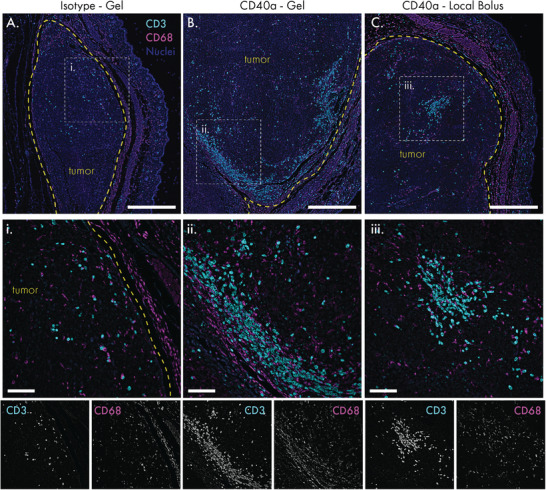
Figure 8.

Locoregional CD40a therapy transforms the tumor immune microenvironment into a more immunogenic state. B16 tumors were explanted for immunohistochemistry 3 days after treatment, and stained for the pan‐T cell marker CD3 (cyan) and the macrophage marker CD68 (magenta). Blue indicates DAPI nuclear stain. A) Tumor tissue treated with isotype control antibody‐loaded hydrogels. B) Tumor tissue treated with 50 µg dose of CD40a in a hydrogel. C) Tumor tissue treated with 50 µg dose of CD40a as a local bolus. Tumor borders are indicated by the yellow dotted line. i–iii) Magnification of CD3+ cell infiltrated zones as indicated by the white dotted lines in (A)–(C). Single channel grayscale images of the CD3 and CD68 stains in the detailed view are provided below. Scale bars: (A)–(C) denote 500 microns; (i)–(iii) denote 100 microns.
