
Figure 2.
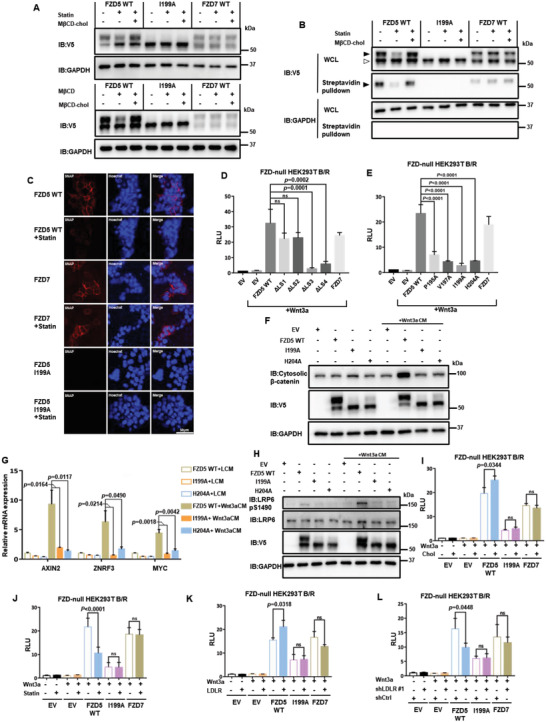
Cholesterol regulates Fzd5 protein levels at the PM and Fzd5‐mediated Wnt/β‐catenin signaling. A) Upper panel shows the mature (upper) band and the immature (lower) band distribution of V5‐tagged Fzd5 WT, I199A, and Fzd7 under normal culture, cholesterol starvation by statin, and rescue conditions in HEK293T cells. Lower panel shows acute cholesterol depletion by MβCD and rescue in HEK293T cells. B) Surface biotin labeling assay of Fzd5 WT, I199A, and Fzd7 under normal, cholesterol starvation (by statin treatment) and rescue conditions (by MβCD‐cholesterol complex treatment). Solid arrow head: mature Fzd; hollowed arrow head: immature Fzd. C) Confocal fluorescent imaging of SNAP‐tagged Fzd5, Fzd7, and Fzd5 I199A on the plasma membrane under normal and statin treatment conditions in HEK293T cells. SNAP‐tagged proteins are labelled with cell‐impermeable SNAP‐Surface549. Hoechst labels the nucleus. All images in the panel are in the same scale. D) TOPFlash assay in Fzd‐null HEK293T while transfecting Fzd5 WT, ΔLS1‐4 mutants, and Fzd7. Error bars mean ± SD, n = 3 replicates, by one‐way ANOVA analysis. E) TOPFlash assay in Fzd‐null HEK293T while transfecting Fzd5 WT, Fzd5 cholesterol binding loss‐of‐function point mutations, and Fzd7. Error bars mean ± SD, n = 3 replicates, by one‐way ANOVA analysis. F) Cytosolic β‐catenin assay of Fzd5 WT, I199A, and H204A under LCM or Wnt3a CM treatment in Fzd‐null HEK293T cells. G) RT‐qPCR assay of Wnt target gene AXIN2, ZNRF3, and MYC in Fzd‐null HEK293T cells. Error bars mean ± SD, n = 3 replicates, by one‐way ANOVA analysis. H) LRP6 phosphorylation assay of Fzd5 WT, I199A, and H204A under LCM or Wnt3a CM treatment in Fzd‐null HEK293T cells. I,J) TOPFlash assay in Fzd‐null HEK293T while transfecting Fzd5 WT, I199A, and Fzd7 under cholesterol addition (I) or cholesterol starvation treatment (J). Error bars mean ± SD, n = 3 replicates, by two‐tailed unpaired student's t‐test analysis. K,L) TOPFlash assay in Fzd‐null HEK293T while transfecting Fzd5 WT, I199A, and Fzd7 under LDLR overexpression (K) or knockdown (L) conditions. Error bars mean ± SD, n = 3 replicates, by two‐tailed unpaired student's t‐test analysis. RLU: relative luciferase unit. ns: not significant.