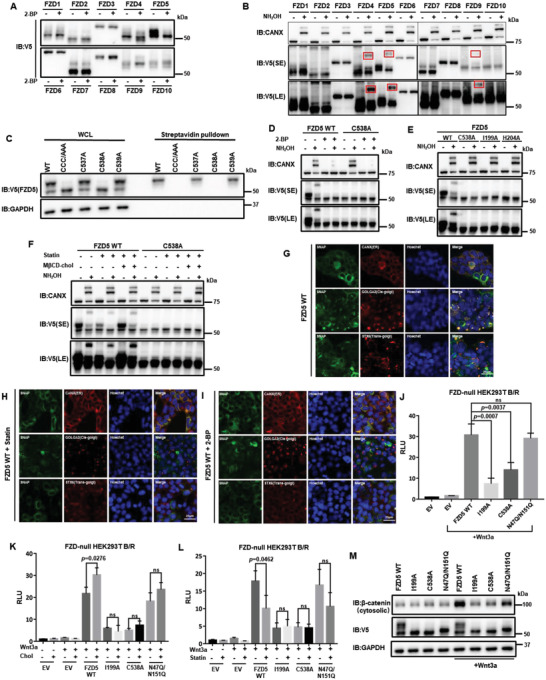
Figure 4.

Cholesterol binding enables Fzd5 S‐palmitoylation, which is required for Fzd5 maturation. A) The band patterns of Fzd1‐10 under 2‐bromopalmitate (2‐BP) treatment in HEK293T cells. B) APE‐assay of Fzd1‐10 for palmitoylation detection in HEK293T cells. Among 10 subtypes, Fzd4, Fzd5, and Fzd9 showed clear band migration due to palmitoylation (highlighted by red boxes). C) Surface biotin labeling of the Cys mutations at Fzd5 cytoplasmic tail. CCC/AAA: C537A/C538A/C539A. D) APE‐assay of Fzd5 WT and C538A under the treatment of 2‐BP in HEK293T cells. E) APE‐assay of Fzd5 WT, C538A, I199A, and H204A in HEK293T cells. F) APE‐assay of Fzd5 WT and C538A under normal, statin treatment and cholesterol rescue conditions in HEK293T cells. G–I). Fluorescent microscopic images showing Fzd5 WT subcellular localizations under normal (G), statin treatment (H), and 2‐BP treatment (I) conditions in HEK293T cells. SNAP‐Fzd5 is labelled by SNAP Cell Oregon Green. CANX (ER), GOLGA2 (cis‐Golgi) and STX6 (trans‐Golgi) are immunofluorescent. All images are in the same scale. J) TOPFlash assay in Fzd‐null HEK293T while transfecting Fzd5 WT, I199A, C538A, and N47Q/N151Q. Error bars mean ± SD, n = 3 replicates, by one‐way ANOVA analysis. K,L) TOPFlash assay in Fzd‐null HEK293T while transfecting Fzd5 WT, I199A, C538A, and N47Q/N151Q under additional cholesterol treatment (K) or statin treatment (L). Error bars mean ± SD, n = 3 replicates, by two‐tailed unpaired student's t‐test analysis. M) Cytosolic β‐catenin assay of Fzd5 WT, I199A, C538A, and N47Q/N151Q under LCM or Wnt3a CM treatment in Fzd‐null HEK293T cells. SE: short exposure. LE: long exposure. RLU: relative luciferase unit. ns: not significant.
