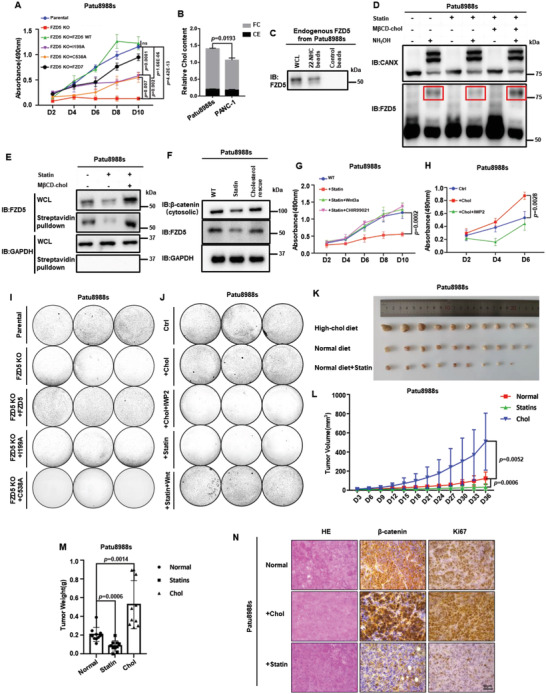
Figure 5.

Cholesterol modulates RNF43‐mutant PDAC growth via Fzd5‐mediated Wnt/β‐catenin activity. A) MTT cell growth assay for Patu8988s Fzd5‐KO cell line and rescues. Error bars mean ± SD, n = 3 replicates, by two‐way ANOVA analysis. B) Quantities of cholesterol contents in PDAC cells. FC: free cholesterol; CE: cholesterol ester. Error bars mean ± SD, n = 3 replicates, by two‐tailed unpaired student's t‐test analysis. C) 22‐NHC pulldown assay of endogenous Fzd5 extracted from Patu8988s cells. D) APE‐assay of endogenous Fzd5 in Patu8988s cells upon cholesterol starvation and repletion treatments. Stripes in the red boxes present palmitoylated Fzd5. CANX is used as control. E) Surface biotin labeling assay of endogenous Fzd5 upon cholesterol starvation and repletion treatments. F) Cytosolic β‐catenin assay of Patu8988s cell under normal, statin treatment and cholesterol rescue conditions. G) MTT cell growth assay for Patu8988s cells under normal, statin, statin+Wnt3a, and statin+CHIR99021 treatment conditions. Error bars mean ± SD, n = 3 replicates, by two‐way ANOVA analysis. H) MTT cell growth assay for Patu8988s cell under normal, cholesterol addition, cholesterol addition+IWP2 (Porcupine inhibitor) conditions. Error bars mean ± SD, n = 3 replicates, by two‐way ANOVA analysis. I) Colony formation assay of parental, Fzd5‐KO and rescued Patu8988s cells. Each set was triplicated. J) Colony formation assay of Patu8988s cell under normal, additional cholesterol, additional cholesterol+IWP2, statin, statin+Wnt treatment conditions. Each set was triplicated. K) The PDAC tumors formed by subcutaneous implantations of Patu8988s cells. From top to bottom, the rows represent high‐cholesterol diet fed group, normal diet fed group, and normal diet plus pravastatin fed group, respectively. n = 10 for each group. L) Subcutaneously implanted tumor size measurement by days. Error bars mean ± SD, n = 10 for each group, by two‐way ANOVA analysis. M) Subcutaneously implanted tumor weight measurements after section at Day36. Error bars mean ± SD, n = 10 for each group, by one‐way ANOVA analysis. N) Immunohistochemistry of subcutaneously implanted tumors and hematoxylin‐eosin staining. For all MTT experiments, D: day. 6‐well plates are used for all colony formation assays. Each circle represents a whole well of a 6‐well plate. ns: not significant.
