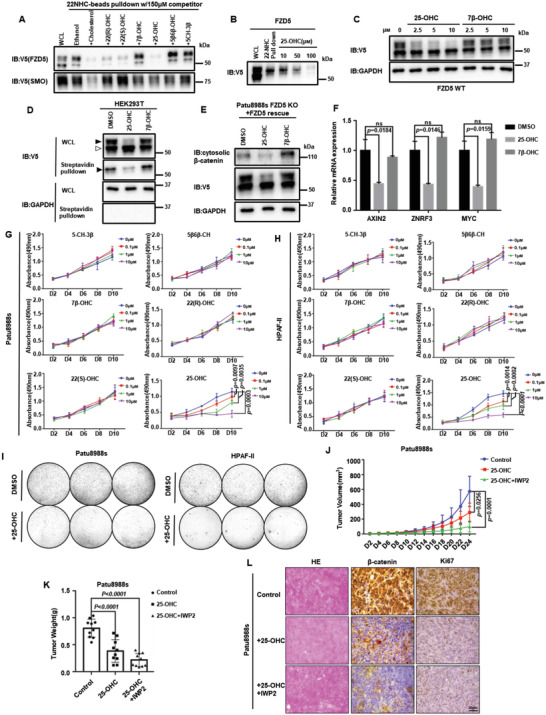
Figure 6.

25‐hydroxysterol alleviates PDAC tumor burden by inhibiting cholesterol‐Fzd5‐Wnt/β‐catenin axis. A) 22‐NHC beads pulldown and competition assay. Ectopically expressed V5‐tagged Fzd5 or Smo was pulled down by 22‐NHC and competed by various oxysterols. B) 22‐NHC beads pulldown and competition assay of V5‐tagged Fzd5 by different doses of 25‐OHC. C) WB assay showing 25‐OHC inhibits Fzd5 maturation at different doses. D) Surface biotin labeling assay of Fzd5 under oxysterol treatments. E) WB assay showing 25‐OHC reduces cytosolic β‐catenin level in Patu8988s cells. F) RT‐qPCR assay showing treatment of 25‐OHC inhibited Wnt target genes including AXIN2, ZNRF3, and MYC in Patu8988s cells. Error bars mean ± SD, n = 3 replicates, by one‐way ANOVA analysis. G,H). MTT cell growth assay of Patu8988s (G) and HPAF‐II (H) under various oxysterol treatments. Error bars mean ± SD, n = 3 replicates, by two‐way ANOVA analysis (If the p‐value is not specified, it is greater than 0.05). I) Colony formation assay of Patu8988s and HPAF‐II cells upon 25‐OHC treatment. Each set was triplicated. J) Subcutaneously implanted tumor size measurements by days of control group, 25‐OHC treatment group, and 25‐OHC+IWP2 treatment group. Error bars mean ± SD, n = 10 for each group, by two‐way ANOVA analysis. K) Subcutaneously implanted tumor weight measurements after section on Day24. Error bars mean ± SD, n = 10 for each group, by one‐way ANOVA analysis. L) Immunohistochemistry of subcutaneously implanted tumors and hematoxylin‐eosin staining. For all MTT experiments, D represents day. 6‐well plates are used for colony formation assay. Each circle represents a whole well of a 6‐well plate. ns: not significant.
