Figure 1.

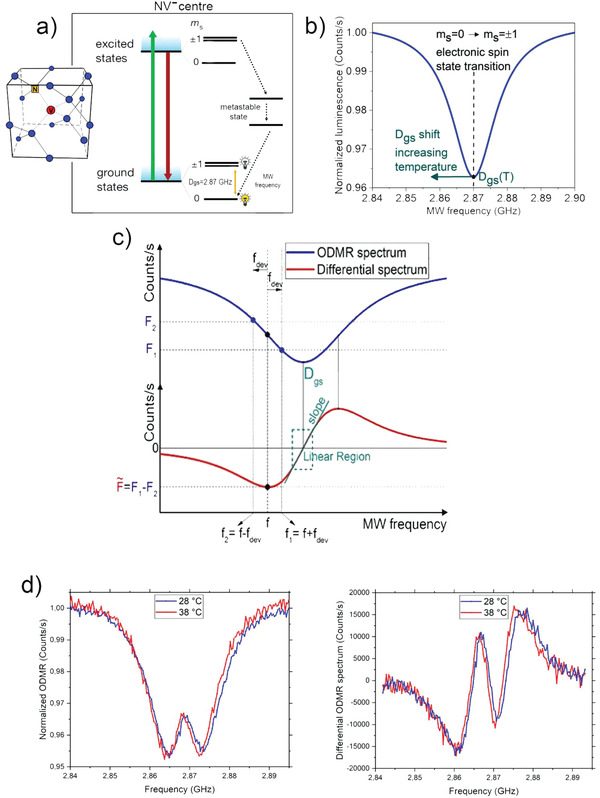
a) NV− state transition that occurs after laser excitation and MW excitation. The coupling of the states |m s = ±1>; with the metastable level generates a statistically lower PL emission than the |m s = 0 >. b) PL collected from the NV− center as a function of the MW frequency. A dip in correspondence of the zero‐field splitting D gs (resonance frequency of the undisturbed NV− center, at room temperature) can be observed. c) Sketch of the differential measurement. From the ODMR spectrum (upper part of the figure) the differential spectrum (lower part of the figure) is derived taking, for every value of the microwave (MW) frequency, the difference in PL between two points (F 1,F 2) separated by 2fdev. is zero at the two extremes of the spectrum and at the resonant frequency D gs. Around D gs there is a region where depends linearly on ΔD gs through the differential spectrum slope. d) Example of ODMR and differential ODMR spectra at two different temperatures.
