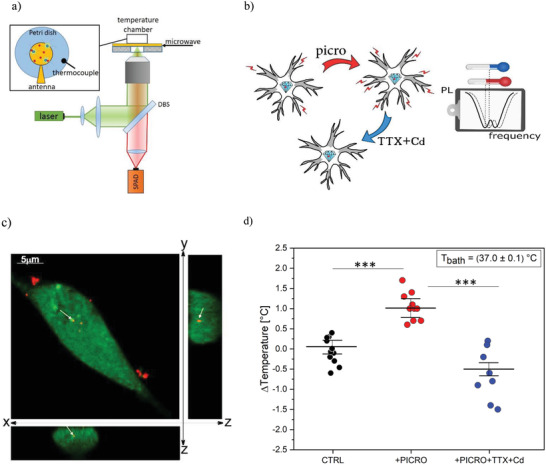
Figure 2.

Illustration of the experiment. a) Simplified scheme of single‐photon confocal ODMR setup. b) The ODMR measurements are performed under control conditions (CTRL), after stimulation with picrotoxin and after the addition of TTX+Cd. The frequency shift in the ODMR spectrum (dashed line) is associated with the temperature variation recorded by the ND sensor. c) Confocal fluorescence micrograph of hippocampal neurons incubated with 0.6 µg mL−1 ND for 5 h. The cytoplasm is stained in green, the red emission is from NDs. The entire field and cross‐sections (XZ and YZ) are shown. White arrows show one internalized ND. d) Boxplot of temperature variations with standard deviations in the presence of saline Tyrode solution (CTRL, black circles), after addition of picrotoxin (PICRO, red circles), after addition of tetrodotoxin and cadmium chloride (TTX+Cd, blue circles), see text for details. Statistical difference is indicated by the asterisks (***, p < 0.0001)
