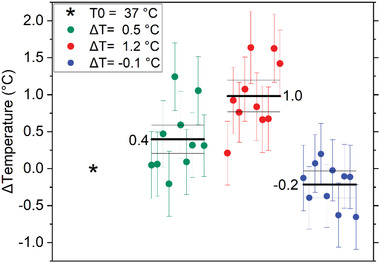
Figure 5.

Validation of temperature detection by ND sensor. The legend box shows the temperature values recorded by the thermocouple. The box plot shows the temperature values recorded by the ND sensor. The mean and its uncertainty (standard deviation divided by the square root of repeated measurements) are reported as horizontal lines in each data set (N = 10, 60 s acquisition). The starting point is highlighted as an asterisk. The incubator temperature at the end of the cycle is consistent with the initial temperature within the incubator stability (0.1 °C).
