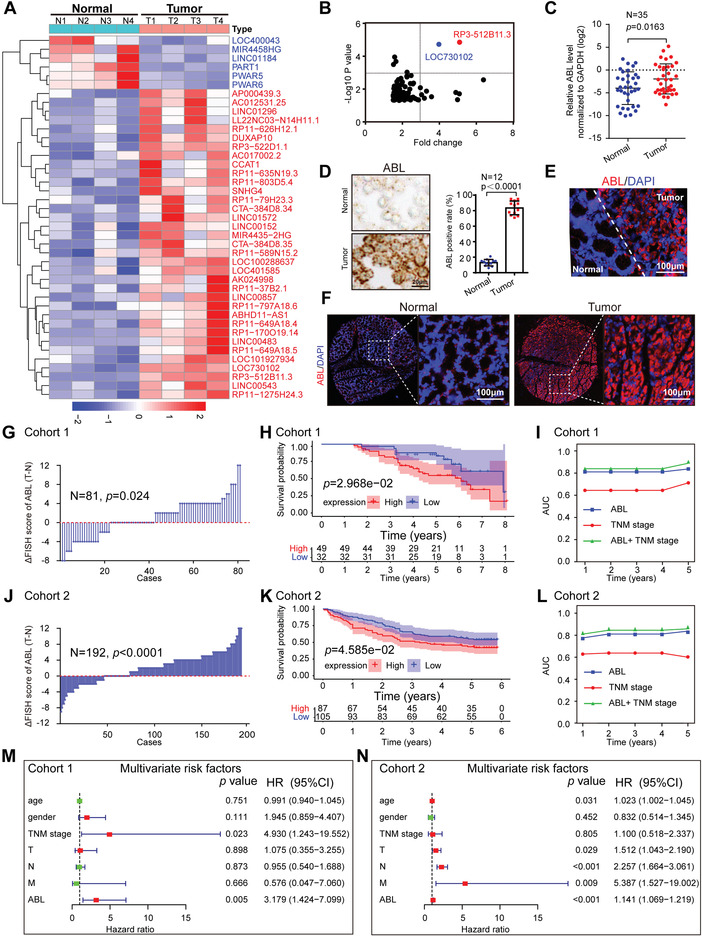
Figure 1.

Elevated ABL expression correlates with a poor prognosis in GC patients. A) Hierarchical clustering showing differentially expressed lncRNAs in cancerous GC tissues and matched normal tissues (fold change > 2 or < 0.5, p < 0.05; n = 4). B) Scatter diagram showing the overlapped upregulated lncRNAs from the significantly differentially expressed candidates ranked by p‐value < 0.05 and fold change > 1.5. C) The levels of ABL expression in paired GC and normal gastric mucosal tissues were measured by qRT‐PCR (n = 35). D) RNAscope detection of ABL expression in GC and adjacent normal tissues (scale bars = 20 µm, n = 12, left panel). Statistical analysis of ABL expression (right panel). E) Representative images of RNA‐FISH staining of GC tissues with an ABL probe. Normal (N) or tumor (T) tissues are marked with dotted lines (scale bars = 100 µm). F) Representative RNA‐FISH images of a tissue microarray (TMA) for cohort 1 stained with the ABL probe (scale bars = 100 µm) are shown (n = 81). G) The distribution of the difference in the ABL score (IRS) (△IRS = IRST−IRSN) in cohort 1. H) Kaplan–Meier OS curves based on ABL expression in patients with GC in cohort 1 (n = 81). I) Time‐dependent receiver operating characteristic (ROC) curve analysis of the clinical risk score (TNM stage), ABL risk score, and combined ABL and clinical risk score in cohort 1. J) The distribution of the difference in the ABL score (IRS) (△IRS = IRST−IRSN) in cohort 2 (n = 192). K) Kaplan–Meier OS curves based on ABL expression in patients with GC in cohort 2. L) Time‐dependent ROC curve analysis of the clinical risk score (TNM stage), the ABL risk score, and the combined ABL and clinical risk score in cohort 2. M,N) Multivariate analyses were performed for GC cohorts 1 and 2. All bars correspond to 95% CIs. AUC, area under the curve; CI, confidence interval. GC, gastric cancer; HR, hazard ratio; OS, overall survival; TNM, tumor, node, metastasis. The differences in IRS for ABL staining in primary tumors and corresponding normal tissues were assessed by the Wilcoxon test (grouped) (G and J). The probability of differences in OS was ascertained by the Kaplan‐Meier method with the log‐rank test (H and K). The data were analyzed by a two‐tailed unpaired Student's t‐test (C and D). The data are represented as the means ± SEM. * p < 0.05; ** p < 0.01; *** p < 0.001, NS, no significance.
