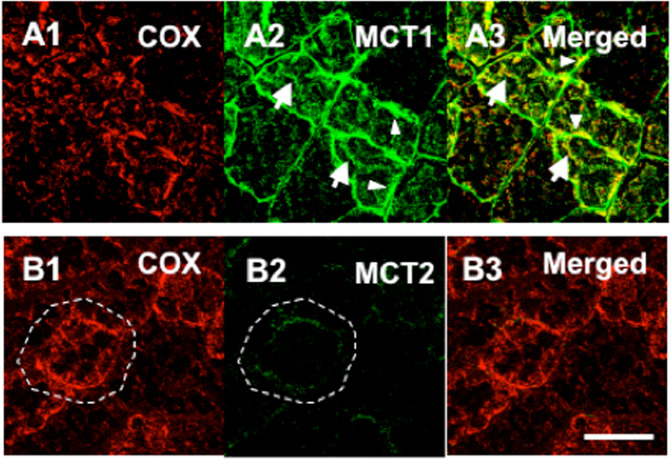
Fig. 3. Plasma and mitochondrial membrane locations of monocarboxylate transporters (MCTs).
Figures showing the cellular locations of MCT1 and MCT2 lactate transporter isoforms and the mitochondrial reticulum (cytochrome oxidase, COx) in adult rat plantaris muscle determined using confocal laser scanning microscopy (CLSM) and fluorescent probes for the respective proteins; comparisons for MCT1 in the first row (Plates A1–A3, respectively) and for MCT2 in the second row (Plates B1–B3, respectively). The localization of COx was detected in rat plantaris muscle (Plates A1 and B1). MCT1 was detected throughout the cells, including the subsarcolemmal (arrowheads) and interfibrillar (arrows) domains (Plate A2). MCT1 abundance was greatest in oxidative fibers where COx was abundant and the signal was strong. When signals from probes for MCT1 (green) and COx (red) were merged, the superimposition of the two probes was clear (yellow), a finding prominent at the interfibrillar (arrows) and sarcolemmal (arrowheads) cell domains (Plate A3). In contrast, the signal for MCT2 (Plate B2) was weak and relatively more noticeable in fibers denoted by strong staining for COx (Plates B1 and B3, broken line delineated around oxidative fibers to distinguish the faint signal for MCT2). The overlap of MCT2 and COx is insignificant, denoted by the absence of yellow in Plate B3. Scale bar = 50 μm. Sections are from the same animal. Reprinted from Hashimoto et al.154.

