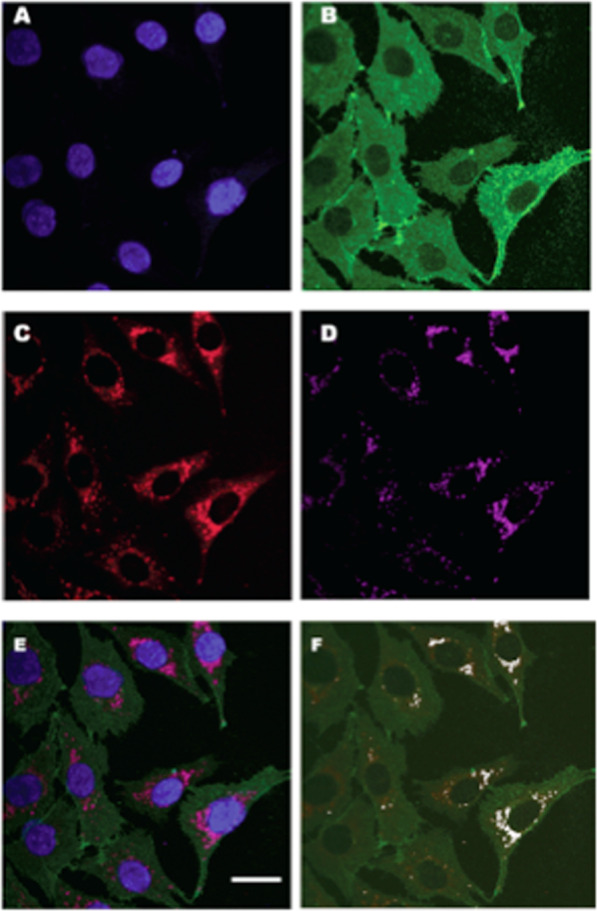
Fig. 7. Cellular colocalization of mitochpondrial lactate (VCTs) and pyruvate transprters (mPCs).

Images assessing the colocalization of MCT1 and mPCs in L6 cells, which show the localization of DAPI-positive nuclei (A), MCT1 (B), mPC1 (C), and MitoTracker-positive MR (D) in L6 cells. The merged images are shown in (E). Colocalization analysis of mPC1 (C) and mitochondria D showed a Pearson correlation coefficient (r2) value of 0.8. Colocalization analysis of MCT1 (B) and mPC1 (C) showed an r2 of 0.3, largely because MCT1 occupies sarcolemmal, mitochondrial and peroxisomal compartments. A channel to represent the colocalization of MCT1 and mitochondria was created to image mMCT1; subsequent colocalization of mMCT1 with mPC1 resulted in an r2 of 0.8 (F). White dots indicate the colocalization of mMCT1 and mPC1 as observed in ImageJ software. Whole images were contrast-enhanced in (A, B, C, D, and E). Similar results were observed for mPC2. Scale bar = 20 µm. It appears that both MCT1 and the putative mPC colocalized to the mitochondria (r2 = 0.8). However, at the light microscopic level, it is impossible to know if the two proteins interact physically and functionally. Additionally, with the benefit of the Orbitrap LC/MS device, we could determine the fractional synthesis rates of mLOC and mPC proteins. From Brooks6.
