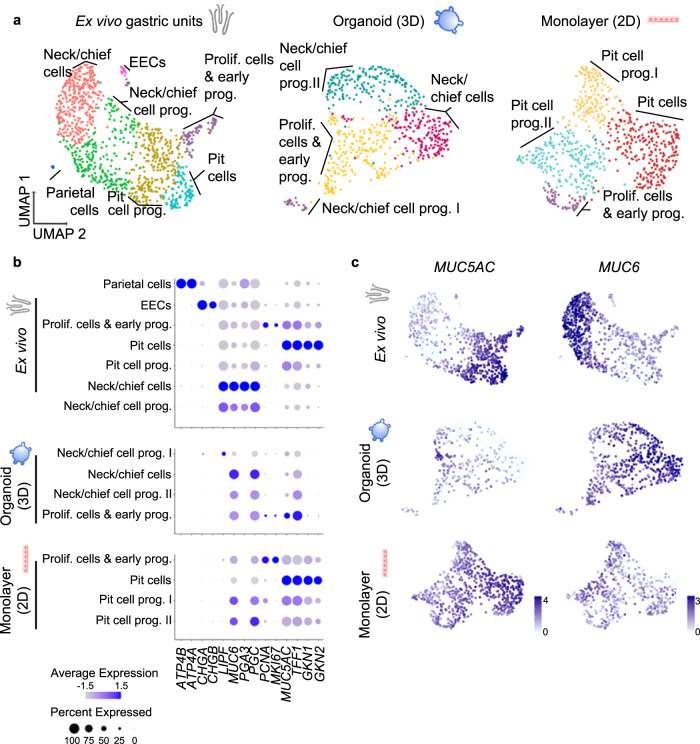
Fig. 1. Organoids and organoid-derived monolayers represent different regions of the gastric units.
a UMAP visualisations of scRNA-seq of ex vivo isolated human gastric units (left, 1022 cells), gastric organoids (centre, 602 cells) and organoid-derived monolayers (right, 696 cells). EEC enteroendocrine cells. Cells are colour-coded according to the annotated clusters. b Dot plot showing the expression of cell type-specific marker genes within the clusters as identified in panel (a). c Expression of the pit cell marker MUC5AC and neck cell marker MUC6 colour-coded and projected on top of the UMAP visualisations as in panel a (data was normalized using ‘LogNormalized’ Seurat method for the expression of the gene within the dataset).

