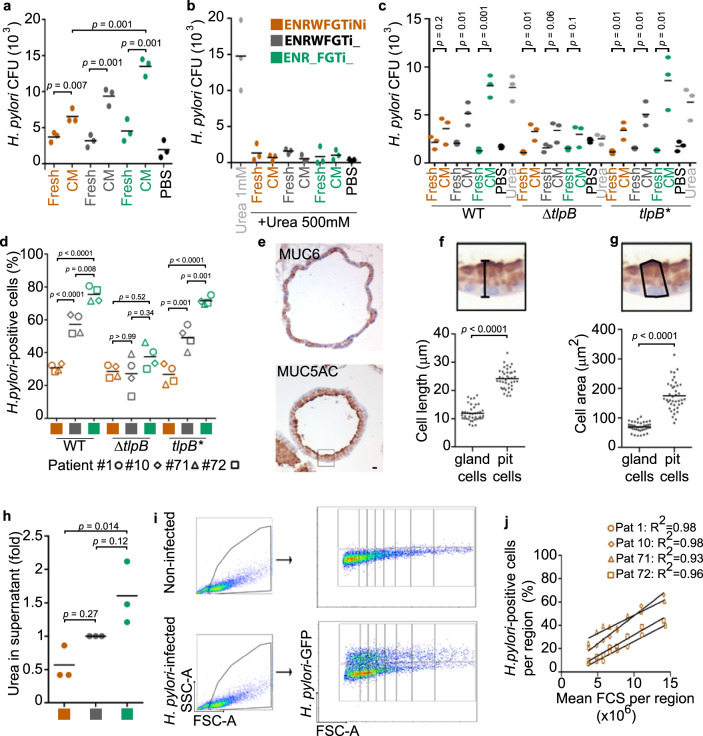
Fig. 5. H. pylori preference for pit cells depends on chemotaxis to urea scaling with size.
a–c Quantification of wild-type (wt, strain P12) bacterial chemotaxis towards conditioned media (a) or conditioned media plus 500 mM urea (b). Chemotaxis by H. pylori strain G27 WT, ΔtlpB and tlpB* (c). d Quantification of adhered H. pylori strains G27 WT, ΔtlpB and tlpB* to organoid-derived monolayers by flow cytometry. e Representative immunohistochemistry images of a 3D organoid stained for MUC5AC and MUC6. Scale bar: 10 µm. f and g Quantification of cell length (f) and cell area (g) of MUC5AC-(pit cells) and MUC6-positive cells (gland cells) in 3D organoids. h Quantification of urea concentration in organoid-derived monolayer conditioned media. Fold over control differentiation media (grey, ENRWFGTi_). i Representative flow cytometry analysis. j Quantification of H. pylori-positive cells in the FCS regions shown in (i). Data are shown as individual dots (panels a-c, and h, filled dot, pool of 4 organoid lines, 3 independent experiments; in panels d and j, symbols represent organoid lines derived from patient #1-circle, #10-diamond, #71-triangle, and #72-square; 3 independent experiments), mean values with horizontal lines (panel d). Data in panel e is representative of 2 organoid lines and 1 experiment. Statistical analysis of data in panels a–c was performed using multiple t-test corrected for multiple comparisons with the Holm–Sidak method; in panels d and h, one-way ANOVA with Tukey’s multiple comparisons post-hoc test.; and in panels f, g, two-tailed Student’s t-test.

