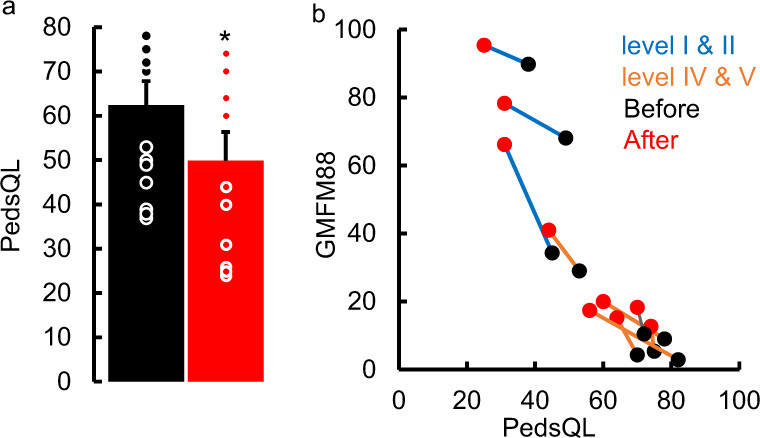
Fig. 3. Quality of Life Changes.

a mean ± SE (n = 12, GMFCS levels I and II, n = 3, GMFCS levels IV and V, n = 9) PedsQL scores before and after therapy. All data were tested for normality using the Kolmogorov-Smirnov test. Based on the result of a normal distribution, paired t-tests were used to compare the group mean data before and after therapy. * Significantly different from before therapy at P < 0.05. Note the max score on the PedsQL is 88 points and a decrease in score represents an improvement in function. b X-Y plot for correlating GMFM-88 scores at start and end of therapy with the PedsQL scores demonstrating that the increase in GMFM-88 scores (improved sensorimotor function of the child) is directly linked to the decrease in PedsQL scores (improved quality of life of parent). Please note, data for n = 12 out of 16 are shown since 4 PedsQL data points were not collected. Source data are provided as a Source Data file.
