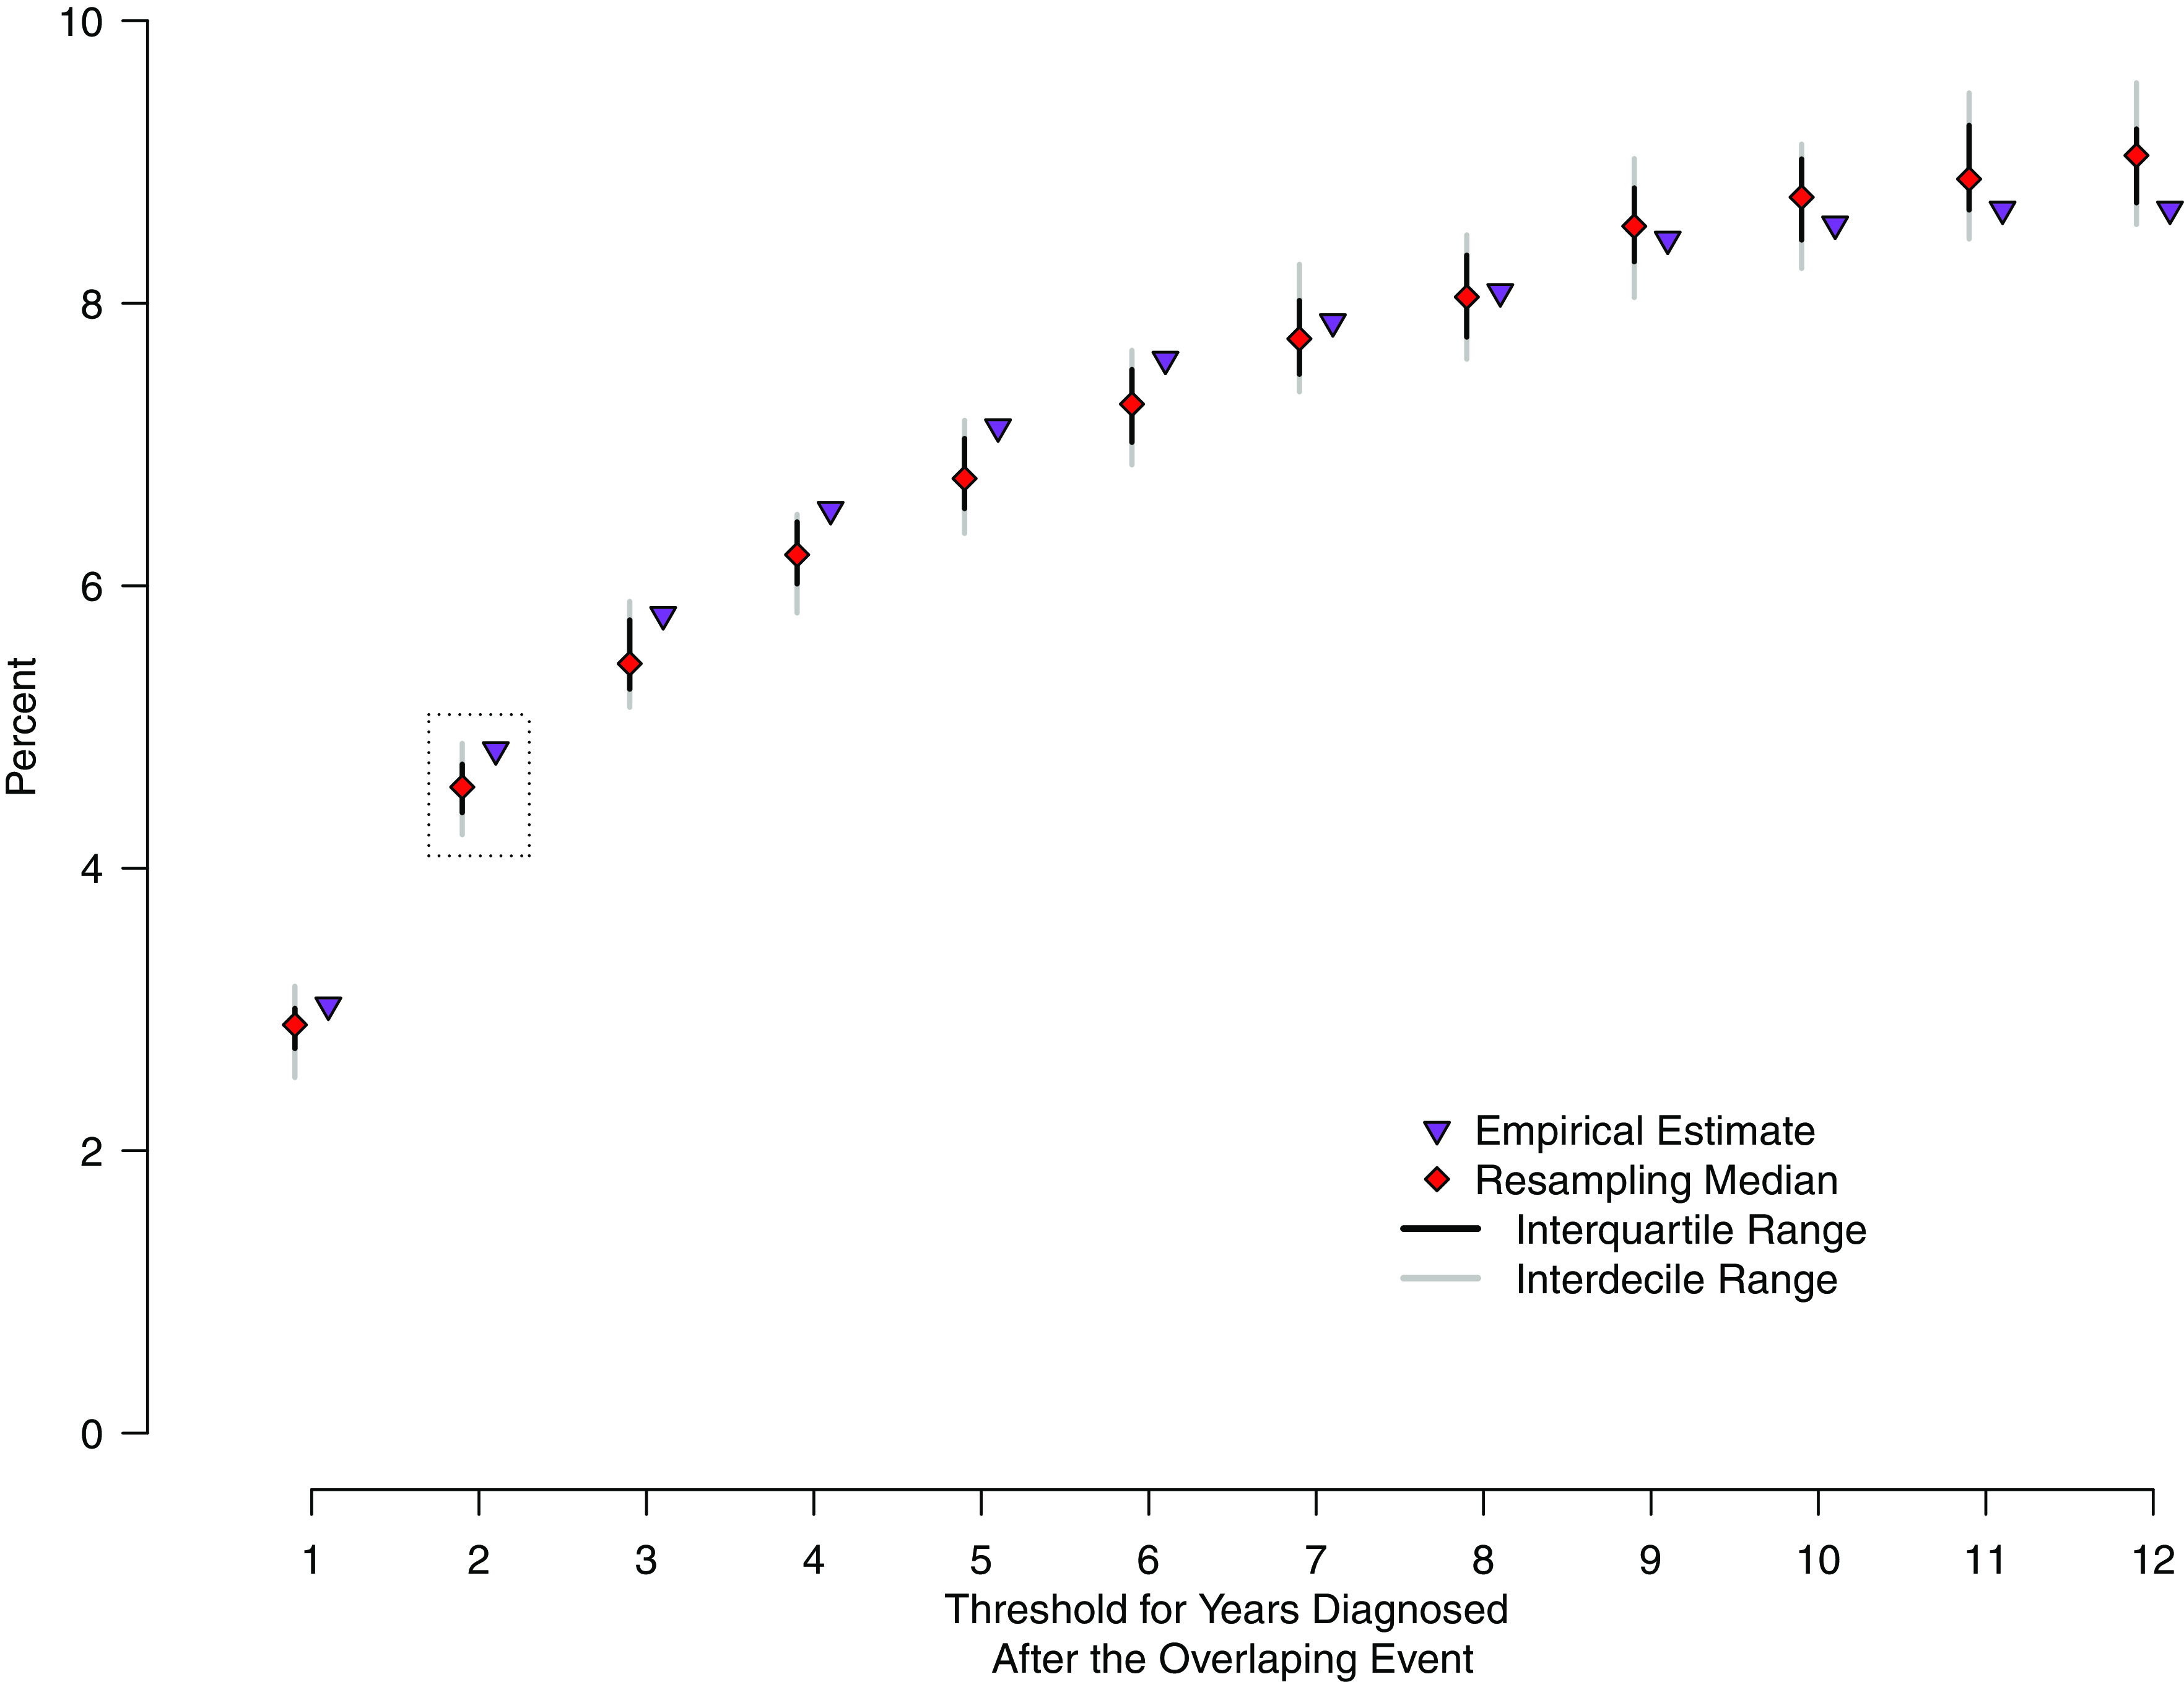
Fig. 2.

Percentage of transmission potentially occurring at a healthcare facility. The empirical and resampling estimates of the proportion of transmission potentially occurring at the healthcare facility across all possible year thresholds. Our primary analysis considered any overlapping event where a case was later diagnosed within 2 years (grey dotted box). Grey and black lines represent the interdecile and interquartile range, respectively, of 15,000 pseudopopulations resampled according to the methods; red diamonds indicate the median. Purple triangles indicate the empirical estimates using only data with original genetic profiles.
