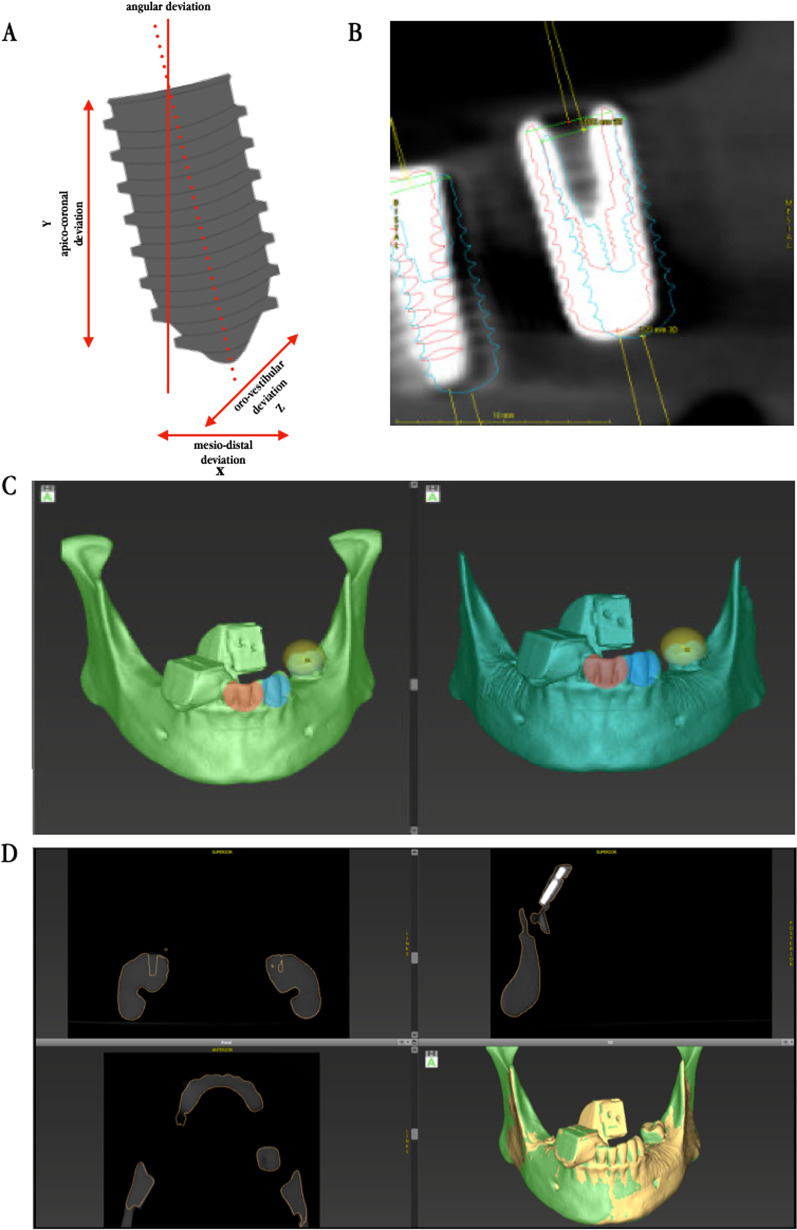
Fig. 4.
A Schematic illustration of spatial offsets from implant planning. Analysis shows deviations in drilling depth, oro-vestibular as well as mesio-distal direction and angulation. B Section of the Treatment Evaluation Tool in coDiagnostix®. Planning is shown in blue. Red shows the actual implant position. C Matching process of pre- and postoperative 3D data set by superimposition after selecting at least three congruent anatomical positions. D Graphical visualization of correlation of pre- and post-operative situation. Successful matching process can be verified in slices and in 3D reconstruction

