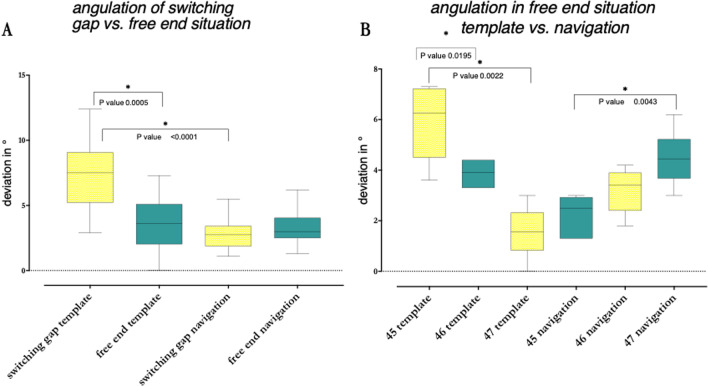
Fig. 6.
A Comparison of the angulation in interdental gap (positions 35 and 36) against free end (positions 45, 46 and 47). n = 60 (12/18/12/18). B Comparison of the angulation within the free end positions (45, 46 and 47) to show increasing inaccuracies with growing distance to the marker. In each case, the distribution spectrum and the corresponding median value are shown. Statistically significant values are shown with an asterisk (*). n = 36 (6/6/6/6/6/6)

