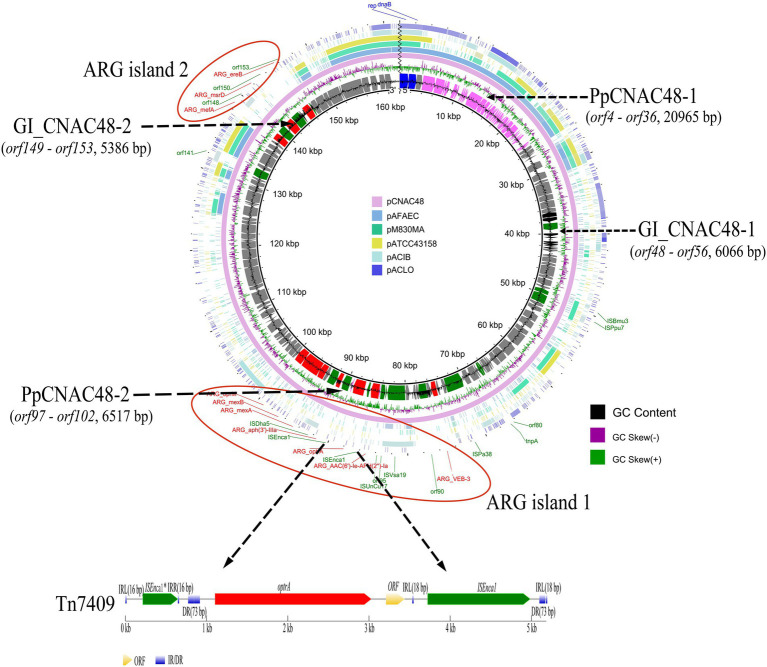
Figure 4.
Schematic of the circularized plasmid sequence and position of the gene clusters associated with putative resistance genes. From inside to outside the ring: the GC Content, GC Skew, pCNAC48, pAFAEC, pM830MA, pATCC43158, pACIB, and pACLO, respectively. Different colors represent different genes, blue represents replication initiation protein, red represents antimicrobial resistance genes, green represents transposable associated genes, purple represents prophage genes, and black represents genomic island genes. The red circle represented the drug resistance gene islands. The arrow’s length and direction indicate the gene’s size and direction. Below is the gene environment of Tn7409. IRL and IRR indicate inverted repeats left and right, respectively. DR indicates direct repeat.

