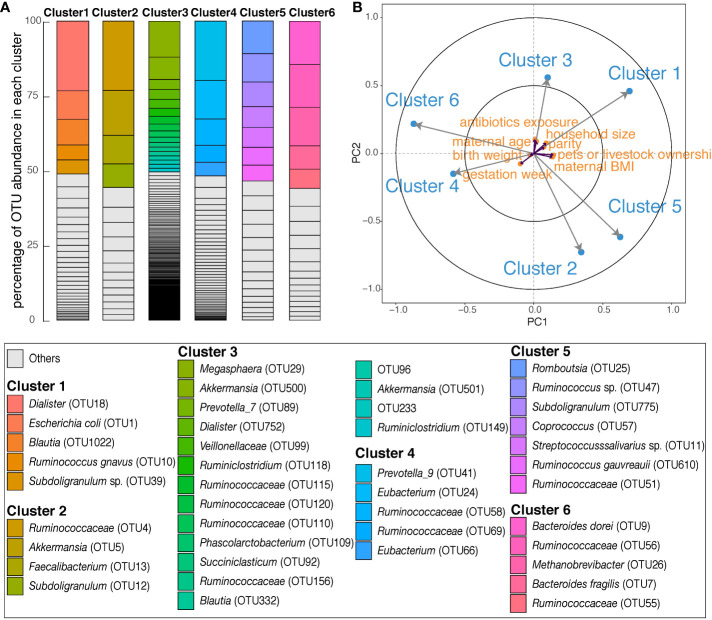
Figure 3.
Overall description of six OTU clusters in maternal gut during late pregnancy. (A) Each column shows the OTU composition of each cluster. Within each column, OTUs are ordered according to the percentage of their relative abundance in each cluster. The identifications of OTUs on species/genus level are listed in the box below; ‘Others’ are in Table S3 . (B) The partial least squares biplot shows the associations between OTU clusters (blue) and covariates (orange). The longer the arrow the stronger the association with other variables. An acute angle between arrows represents positive association, an obtuse angle represents negative association and orthogonal arrows represent no association.

