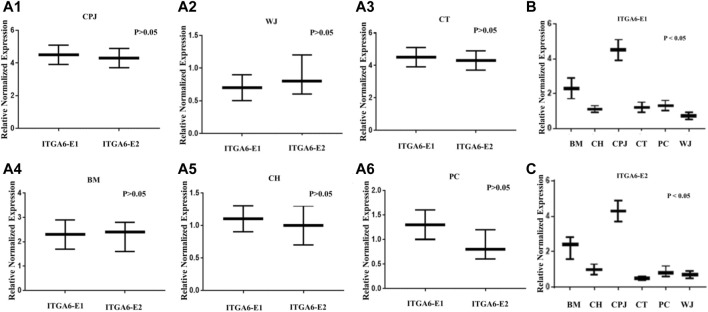
FIGURE 3.
The expression of ITGA6 in the MSCs. (A1–A6) The t-test showed no statistically significant difference in expressions of ITGA6-E1 and ITGA6-E2 in the same MSC, p > 0.05. (B–C) A one-way ANOVA revealed a statistically significant difference in the expressions of ITGA6-E1 and ITGA6-E2, respectively in the six MSCs, p < 0.05.

