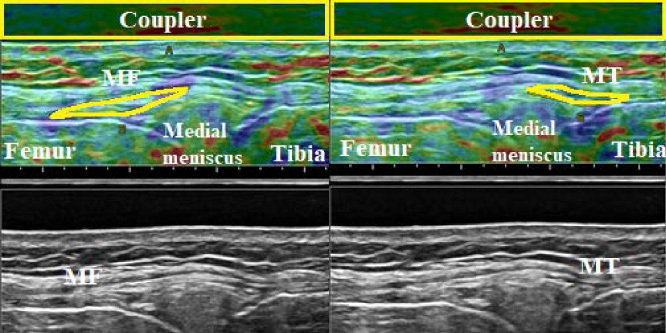
Fig. 7.

Elastographic (top) and B-mode images (bottom) of the meniscofemoral (MF, left) and meniscotibial (MT, right) portions of the deep medial collateral ligament (dMCL) at 0° knee flexion. The ROI of the acoustic coupler is indicated as a yellow rectangle, and the ROI of each ligament portion is outlined in yellow.
